
 Submit an article

Articles
- Page Path
- HOME > J Korean Acad Nurs > Volume 55(1); 2025 > Article
-
Research Paper
간호연구에서의 형성적 측정 모형과 반영적 측정 모형: 횡단적 연구의 2차 자료 분석 -
박은서1
 , 조영일1, 김효진2, 임여진3, 김동희4
 - Formative versus reflective measurement models in nursing research: a secondary data analysis of a cross-sectional study in Korea
-
Eun Seo Park1, Young Il Cho1, Hyo Jin Kim2, YeoJin Im3, Dong Hee Kim4
-
Journal of Korean Academy of Nursing 2025;55(1):107-118.
DOI: https://doi.org/10.4040/jkan.24095
Published online: February 19, 2025
1동국대학교 경찰사법대학
2서울대학교 간호대학
3경희대학교 간호과학대학
4성신여자대학교 간호대학
1College of Police and Criminal Justice, Dongguk University, Seoul, Korea
2College of Nursing, Seoul National University, Seoul, Korea
3College of Nursing Science, Kyung Hee University, Seoul, Korea
4College of Nursing, Sungshin Women’s University, Seoul, Korea
- Corresponding author YeoJin Im College of Nursing Science, Kyung Hee University, SPACE21, 26 Kyungheedae-ro, Dongdaemun-gu, Seoul 02447, Korea E-mail: imyj@khu.ac.kr
- Dong Hee Kim College of Nursing, Sungshin Women’s University, 55 Dobong-ro 76ga-gil, Gangbuk-gu, Seoul 01133, Korea E-mail: dhkim@sungshin.ac.kr
• Received: August 7, 2024 • Revised: September 20, 2024 • Accepted: January 3, 2025
© 2025 Korean Society of Nursing Science
This is an Open Access article distributed under the terms of the Creative Commons Attribution NoDerivs License (http://creativecommons.org/licenses/by-nd/4.0) If the original work is properly cited and retained without any modification or reproduction, it can be used and re-distributed in any format and medium.


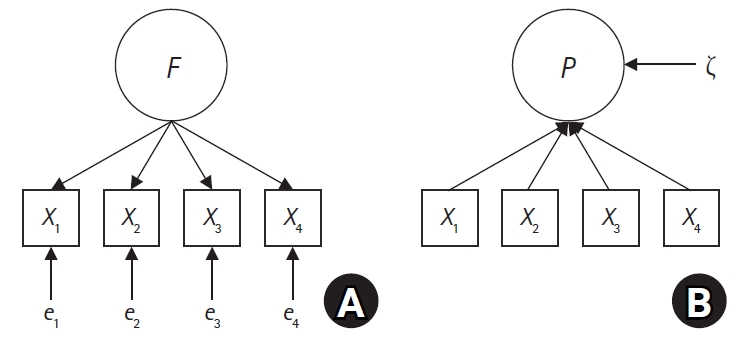
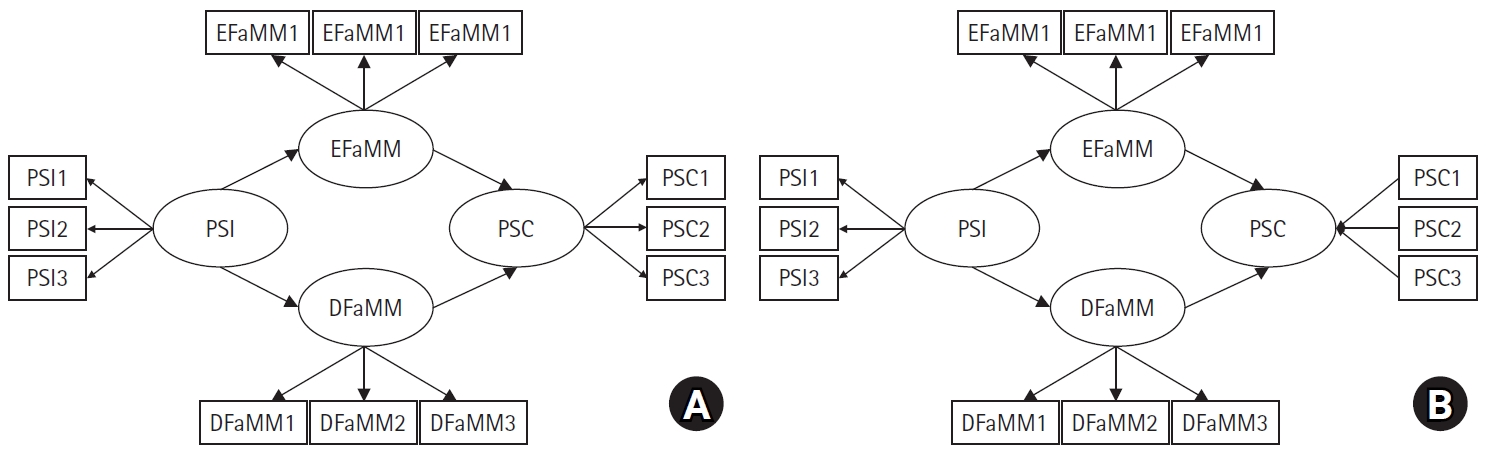
Figure & Data
REFERENCES
Citations
Citations to this article as recorded by 
- The strategic role of proactivity and socioemotional wealth in family firm success
Felipe Hernández-Perlines, Luis Araya-Castillo, Mercedes Castro-Nuño
Journal of Innovation & Knowledge.2026; 18: 101097. CrossRef - What Makes the Structural Equation Model (SEM) Challenging? A Review of Methodological, Statistical, and Practical Challenges
Loso Judijanto, Sri Nurhayati
WSEAS TRANSACTIONS ON INFORMATION SCIENCE AND APPLICATIONS.2026; 23: 447. CrossRef
 ePub Link
 Cite
Cite XML Download
Formative versus reflective measurement models in nursing research: a secondary data analysis of a cross-sectional study in Korea
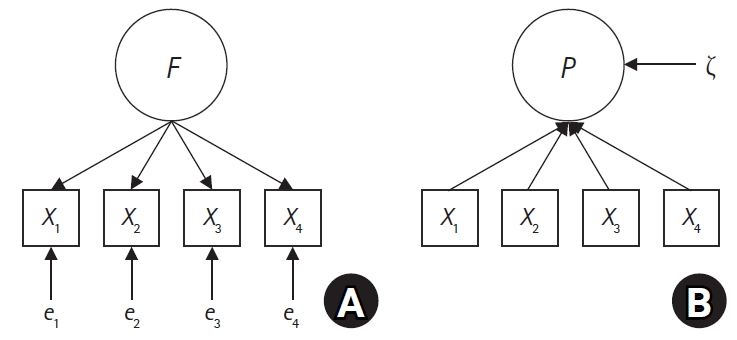
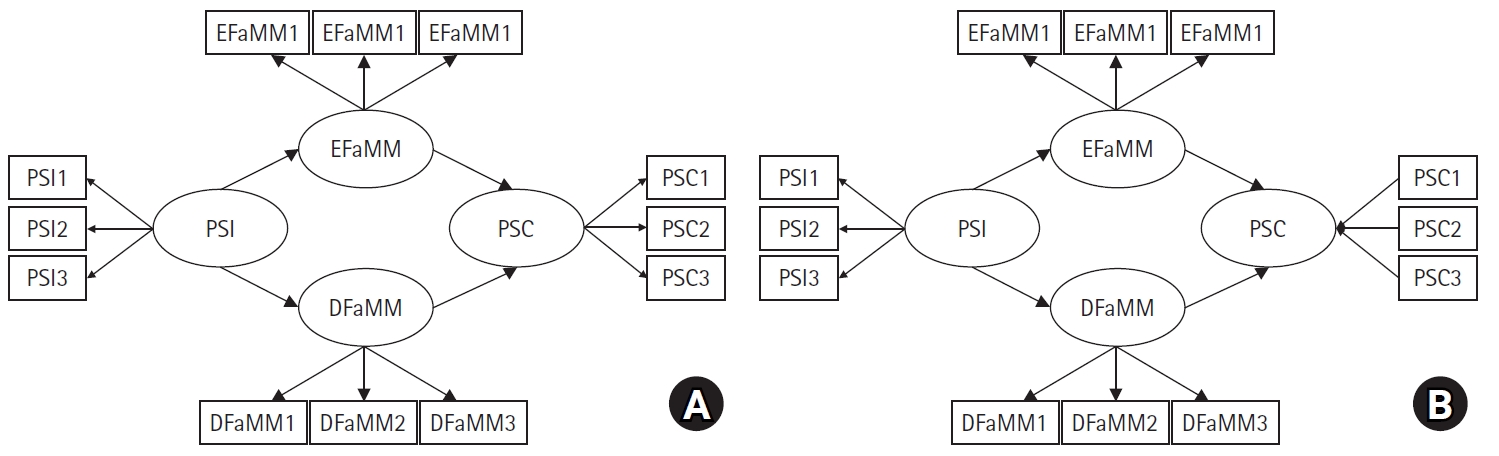
Fig. 1. Reflective measurement model (A) and formative measurement model (B). F, factor (latent variable); X, measurement variable; e, unique factor; P, principal component; ζ, disturbance term.
Fig. 2. Research models based on covariance-based structural equation model (CB-SEM) (A) and partial least square structural equation model (PLS-SEM) (B). DFaMM, difficult family management measure; EFaMM, easy family management measure; PSC, Pediatric Symptom Checklist Scale; PSI, Parenting Stress Index.
Fig. 1.
Fig. 2.
Formative versus reflective measurement models in nursing research: a secondary data analysis of a cross-sectional study in Korea
| B | Est | SE | t | β | Variance | p | |
|---|---|---|---|---|---|---|---|
| Paths | |||||||
| PSC ← EFaMM | –0.35 | - | .05 | –7.58 | –1.21 | - | <.001 |
| PSC ← DFaMM | –0.20 | - | .05 | –4.43 | –0.61 | - | <.001 |
| EFaMM ← PSI | –1.43 | - | .11 | –13.27 | –1.05 | - | <.001 |
| DFaMM ← PSI | 1.00 | - | .08 | 12.10 | 0.83 | - | <.001 |
| Variance | |||||||
| PSI | - | 0.24 | .03 | 8.09 | - | 1.00 | <.001 |
| EFaMM | - | –0.05 | .01 | –3.48 | - | –0.11 | <.001 |
| DFaMM | - | 0.11 | .02 | 6.79 | - | 0.31 | <.001 |
| PSC | - | 0.02 | .00 | 5.89 | - | 0.46 | <.001 |
| Construct/indicator | Cronbach’s α | Composite reliability (ρA) | Construct reliability (ρC) | AVE | VIF | λ (95% CI) | Outer weights (95% CI) |
|---|---|---|---|---|---|---|---|
| Reflective measurement model | |||||||
| EFaMM | .66 | .66 | .66 | .40 | |||
| EFaMM1 | 1.44 | .61 (0.53–0.67) | 0.42 (0.37–0.46) | ||||
| EFaMM2 | 1.73 | .60 (0.51–0.66) | 0.41 (0.37–0.44) | ||||
| EFaMM3 | 1.64 | .68 (0.60–0.75) | 0.47 (0.42–0.51) | ||||
| DFaMM | .83 | .88 | .84 | .64 | |||
| DFaMM1 | 1.27 | .69 (0.61–0.76) | 0.34 (0.30–0.36) | ||||
| DFaMM2 | 1.56 | .99 (0.93–1.04) | 0.48 (0.45–0.51) | ||||
| DFaMM3 | 1.31 | .68 (0.60–0.74) | 0.33 (0.30–0.36) | ||||
| PSI | .77 | .77 | .77 | .53 | |||
| PSI1 | 1.72 | .78 (0.71–0.83) | 0.43 (0.39–0.47) | ||||
| PSI2 | 2.36 | .76 (0.69–0.81) | 0.42 (0.39–0.45) | ||||
| PSI3 | 1.91 | .63 (0.55–0.70) | 0.35 (0.32–0.38) | ||||
| Formative measurement model | |||||||
| PSC | .77 | .81 | .87 | .68 | |||
| PSC1 | 1.35 | .84 (0.79–0.86) | 0.51 (0.45–0.57) | ||||
| PSC2 | 2.00 | .84 (0.79–0.88) | 0.38 (0.33–0.42) | ||||
| PSC3 | 1.87 | .80 (0.73–0.83) | 0.32 (0.26–0.36) |
| Paths | B (bootstrapping 95% CI) | t | R2 |
|---|---|---|---|
| PSI → EFaMM | –0.91 (–0.98 to –0.85) | –27.89 | .84 |
| PSI → DFaMM | 0.69 (0.62 to 0.75) | 21.02 | .48 |
| EFaMM → PSC | –1.23 (–2.52 to –0.79) | –0.65 | .53 |
| DFaMM → PSC | –0.64 (–1.93 to –0.20) | –0.34 |
Table 1. Unstandardized and standardized path coefficients for the covariance-based structural equation model (N=277)
DFaMM, difficult family management measure; EFaMM, easy family management measure; Est, estimate; PSC, Pediatric Symptom Checklist Scale; PSI, Parenting Stress Index; SE, standard error.
Table 2. Parameter estimation for the measurement models (N=277)
AVE, average variance extracted; CI, confidence interval; DFaMM, difficult family management measure; EFaMM, easy family management measure; PSC, Pediatric Symptom Checklist Scale; PSI, Parenting Stress Index; VIF, variance inflation factor; λ, factor loading.
Table 3. Path coefficients and R2 value of the partial least squares structural equation model (N=277)
CI, confidence interval; DFaMM, difficult family management measure; EFaMM, easy family management measure; PSC, Pediatric Symptom Checklist Scale; PSI, Parenting Stress Index.


