
 Submit an article

Articles
- Page Path
- HOME > J Korean Acad Nurs > Volume 56(2); 2026 > Article
-
Research Paper
- Effects of a practitioner-led empowerment program for low-income social service recipients in South Korea: a quasi-experimental study
-
Myung Sun Hyun1
 , Eunyoung Park2, Hyuncheol Kang3, Mi-hye Kim4
 -
Journal of Korean Academy of Nursing 2026;56(2):276-288.
DOI: https://doi.org/10.4040/jkan.26015
Published online: May 26, 2026
1Research Institute of Nursing Science, College of Nursing, Ajou University, Suwon, South Korea
2College of Nursing, Chungnam National University, Daejeon, South Korea
3Department of Big Data and AI, College of AI Convergence, Hoseo University, Asan, South Korea
4College of Nursing, Soonchunhyang University, Cheonan, South Korea
- Corresponding author: Eunyoung Park College of Nursing, Chungnam National University, 266 Munhwa-ro, Jung-gu, Daejeon 35015, South Korea E-mail: eypark@cnu.ac.kr
• Received: February 3, 2026 • Revised: April 29, 2026 • Accepted: April 29, 2026
© 2026 Korean Society of Nursing Science
This is an Open Access article distributed under the terms of the Creative Commons Attribution NoDerivs License (http://creativecommons.org/licenses/by-nd/4.0) If the original work is properly cited and retained without any modification or reproduction, it can be used and re-distributed in any format and medium.
- 1,252 Views
- 146 Download


Abstract
-
Purpose
- This study aimed to evaluate the effects of a practitioner-led empowerment program on self-sufficiency motivation, self-esteem, and self-efficacy among low-income service recipients at self-sufficiency centers.
-
Methods
- A quasi-experimental repeated-measures design was used. Participants were recipients of social services from 11 local self-sufficiency centers in Gyeonggi-do, South Korea. In total, 100 participants were recruited, with 51 assigned to the experimental group and 49 assigned to the control group. The experimental group received an eight-session program delivered by center practitioners who had been trained by mental health nurses, whereas the control group received usual services. Self-sufficiency motivation, self-esteem, and self-efficacy were assessed at three time points: baseline (pretest: T0), immediately after the intervention (post-test: T1), and 4 weeks after the intervention (follow-up: T2).
-
Results
- Using generalized estimating equations, participants in the experimental group showed significantly greater improvements than those in the control group at both T1 and T2 in self-sufficiency motivation (T1: B=1.61, p=.030; T2: B=2.88, p<.001), self-esteem (T1: B=2.77, p<.001; T2: B=2.78, p<.001), and self-efficacy (T1: B=3.95, p=.004; T2: B=4.19, p<.001).
-
Conclusion
- The practitioner-led program is associated with significant short-term improvements in psychosocial determinants of self-sufficiency among low-income service recipients. These findings may inform the development of community nursing interventions that support the psychosocial foundations of independent living in this population and provide a basis for training programs designed to strengthen the capacity of practitioners at local self-sufficiency centers (Clinical Research Information Service of Korea registration number: KCT0010027; registration date: December 12, 2024).
Introduction
Methods
Results
Discussion
Conclusion
-
Conflicts of Interest
No potential conflict of interest relevant to this article was reported.
-
Acknowledgements
None.
-
Funding
This study was supported by a National Research Foundation of Korea grant funded by the Korean Government (Ministry of Science and ICT) (No. NRF-2020R1A2C1102793).
-
Data Sharing Statement
Please contact the corresponding author for data availability.
-
Author Contributions
Conceptualization: MH, EP, MK. Methodology: MH, EP, MK. Software: MH, HK. Validation: MH, EP, HK, MK. Formal analysis: MH, EP, HK, MK. Investigation: MH, MK. Resources: MH, HK. Data curation: MH, EP, HK, MK. Visualization: MH, EP, MK. Supervision: MH. Project administration: MH. Funding acquisition: MH. Writing–original draft: MH, EP, HK, MK. Writing–review & editing: MH, EP, HK, MK. Final approval of the manuscript: all authors.
Article Information
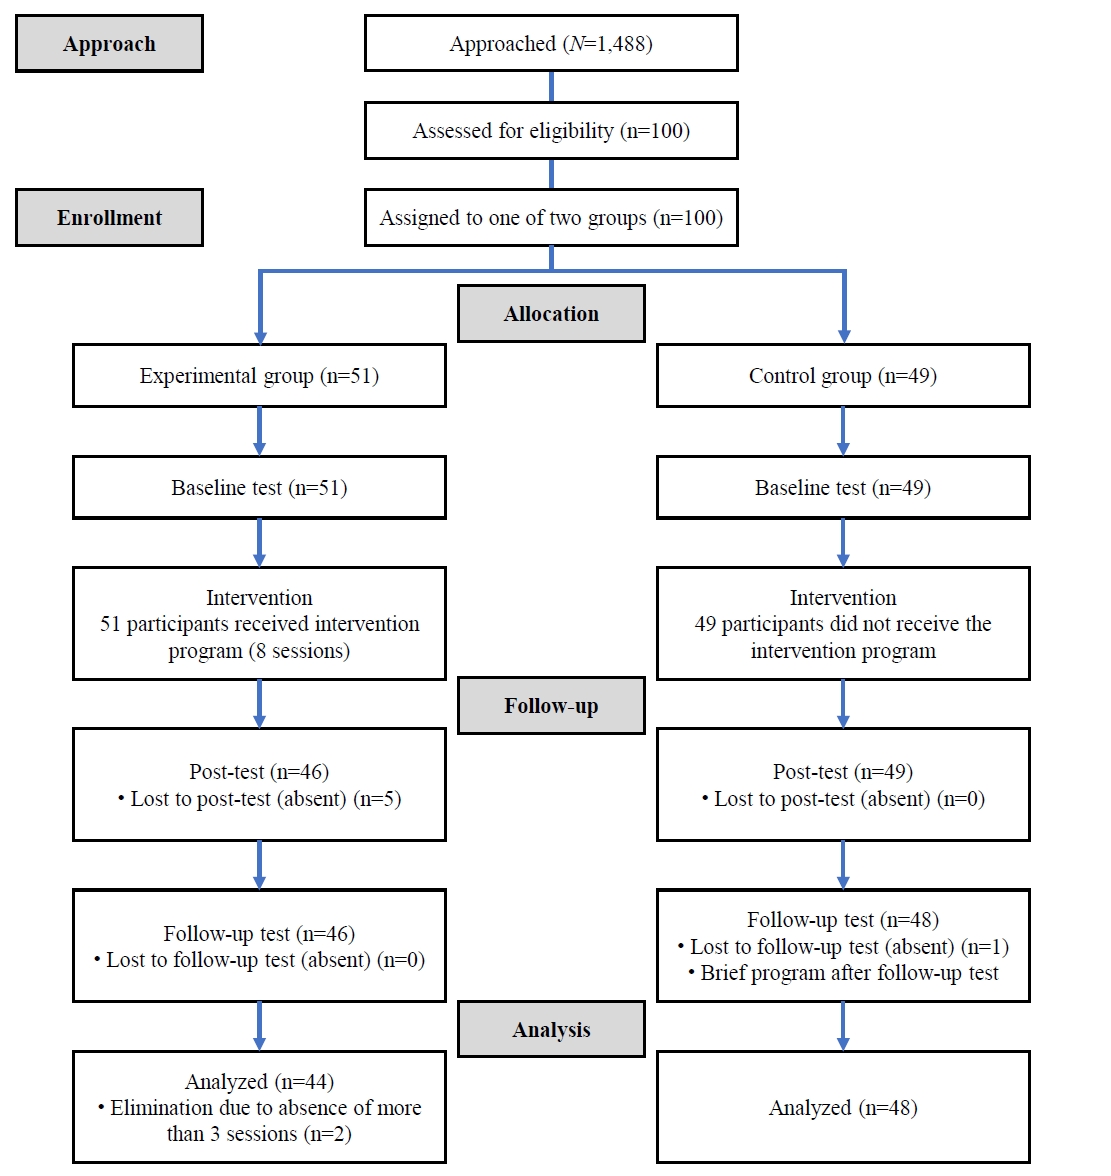
Table 1.Contents of the reality therapy-based empowerment program
Table 2.Homogeneity testing for general characteristics and baseline variables between the two groups (N=92)
| Characteristic | Total (N=92) | Exp. (n=44) | Cont. (n=48) | t, z, or χ² | p |
|---|---|---|---|---|---|
| Age (yr) | 52.70±10.89 | 52.27±11.55 | 53.08±10.35 | –0.70a) | .944 |
| Gender | 4.19 | .041 | |||
| Men | 38 (41.3) | 23 (52.3) | 15 (31.3) | ||
| Women | 54 (58.7) | 21 (47.7) | 33 (68.7) | ||
| Education | 1.41b) | .723 | |||
| Elementary school | 3 (3.3) | 1 (2.3) | 2 (4.2) | ||
| Middle school | 14 (15.2) | 5 (11.4) | 9 (18.8) | ||
| High school | 59 (64.1) | 30 (68.1) | 29 (60.3) | ||
| College | 16 (17.4) | 8 (18.2) | 8 (16.7) | ||
| Marital statusc) | 3.04 | .385 | |||
| Unmarried | 24 (26.4) | 15 (34.1) | 9 (19.1) | ||
| Separation, divorce | 38 (41.7) | 16 (36.3) | 22 (46.9) | ||
| Married | 16 (17.6) | 8 (18.2) | 8 (17.0) | ||
| Widowed | 13 (14.3) | 5 (11.4) | 8 (17.0) | ||
| Religion | 1.97 | .161 | |||
| Have | 57 (62.0) | 24 (54.5) | 33 (68.7) | ||
| Have not | 35 (38.0) | 20 (45.5) | 15 (31.3) | ||
| Duration of being a recipient (mo) | 14.91±10.81 | 13.05±9.66 | 16.73±11.64 | –1.44a) | .150 |
| Monthly income (10,000 Korean won) | 131.75±25.47 | 132.70±21.72 | 130.90±28.62 | –0.82a) | .414 |
| SS motivationa) | 30.57±4.29 | 29.57±4.78 | 31.48±3.60 | –2.19 | .029 |
| Self-esteem | 29.05±4.45 | 28.23±4.75 | 29.81±4.05 | –1.73 | .088 |
| Self-efficacya) | 61.07±10.16 | 59.11±10.71 | 62.89±9.37 | –1.69 | .092 |
Table 3.Changes in study outcomes over time (N=92)
| Variable | T0 | T1 | T2 | T1–T0 | Effect sizea) | T2–T0 | Effect sizea) |
|---|---|---|---|---|---|---|---|
| Self-sufficiency motivation | 0.45 | 0.82 | |||||
| Exp. (n=44) | 29.57±4.78 | 30.89±4.86 | 30.57±5.07 | 1.32±3.47 | 1.00±3.62 | ||
| Con. (n=48) | 31.48±3.60 | 31.19±4.09 | 29.60±3.61 | –0.29±3.72 | –1.88±3.40 | ||
| Self-esteem | 0.84 | 0.85 | |||||
| Exp. (n=44) | 28.23±4.75 | 30.91±4.86 | 30.61±4.63 | 2.68±3.65 | 2.39±3.79 | ||
| Con. (n=48) | 29.81±4.05 | 29.73±4.59 | 29.42±4.59 | –0.08±2.91 | –0.40±2.76 | ||
| Self-efficacy | 0.61 | 0.71 | |||||
| Exp. (n=44) | 59.11±10.71 | 63.27±10.04 | 62.77±10.54 | 4.16±7.21 | 3.66±6.65 | ||
| Con. (n=48) | 62.89±9.37 | 63.06±9.32 | 62.33±8.40 | 0.21±5.77 | –0.53±5.09 |
Values are presented as mean±standard deviation unless otherwise stated.
Cont, control group; Exp, experimental group; T0, baseline; T1, post-test; T2, follow-up test; T1–T0, mean difference between baseline and post-test; T2–T0, mean difference between baseline and follow-up test.
a)Effect sizes are presented as absolute values.
Table 4.Results of the generalized estimating equation analysis (N=92)
- 1. Ministry of Health and Welfare (MOHW). Guide to self-reliance program in 2024 [Internet]. MOHW; 2024 [cited 2025 Jan 12]. Available from: https://www.mohw.go.kr/board.es?mid=a10409020000&bid=0026&list_no=1480367&act=view
- 2. Park JM, Yoo TK, Choi SY. The effect of participant’s mental health on workfare program outcome. Soc Welf Policy. 2014;41(4):125-146. https://doi.org/10.15855/swp.2014.41.4.125Article
- 3. Hong PY, Choi S, Key W. Psychological self-sufficiency: a bottom-up theory of change in workforce development. Soc Work Res. 2018;42(1):22-32. https://doi.org/10.1093/swr/svx025Article
- 4. Baek H, Han K, Lee S, Cho S. A qualitative study of the incentives and obstacles for participation in self-sufficiency program of community self-sufficiency center among the working poor. Soc Welf Policy. 2016;43(2):241-275. https://doi.org/10.15855/swp.2016.43.2.241Article
- 5. Kim JW, Lee MK, Jeon SN. A measure for system improvement of self-sufficiency program: focusing on a social economy development strategy. J Crit Soc Welf [Internet]. 2013 [cited 2025 Jan 12];(38):7-44. Available from: https://www.kci.go.kr/kciportal/ci/sereArticleSearch/ciSereArtiView.kci?sereArticleSearchBean.artiId=ART001747511
- 6. Kim KH, Cho S, Choi S, Han E. Development and validation of self-sufficiency scale from a process perspective. J Korean Soc Welf Adm. 2022;24(2):89-118. https://doi.org/10.22944/kswa.2022.24.2.004Article
- 7. Lee S, Oh S, Lee W, Ko E, Hwang Y. A study on the participant profile in the 2024 self-sufficiency program [Internet]. Korea Development Institute for Self-Sufficiency and Welfare; 2024 [cited 2025 Jan 12]. Report No.: 2024-01. Available from: https://kdissw.or.kr/board.es?mid=a10301010000&bid=0006&act=view&list_no=7899&tag=&nPage=1
- 8. Hong PY, Hodge DR, Choi S. Spirituality, hope, and self-sufficiency among low-income job seekers. Soc Work. 2015;60(2):155-164. https://doi.org/10.1093/sw/swu059ArticlePubMed
- 9. Boschman S, Maas I, Vrooman JC, Kristiansen MH. From social assistance to self-sufficiency: low income work as a stepping stone. Eur Sociol Rev. 2021;37(5):766-782. https://doi.org/10.1093/esr/jcab003Article
- 10. Kim MR, Lee HS, Lee JH. A qualitative study on the experience of participation in the self-sufficiency gateway. J Public Policy Stud. 2019;35(2):145-168. https://doi.org/10.33471/ILA.35.2.7Article
- 11. O’Shaughnessy BR, Michelle Greenwood R. Empowering features and outcomes of homeless interventions: a systematic review and narrative synthesis. Am J Community Psychol. 2020;66(1-2):144-165. https://doi.org/10.1002/ajcp.12422ArticlePubMed
- 12. Song IH, Kim TH, Kim YK, An SM. Factors affecting emotional self-sufficiency among job training program participants. Korean J Soc Welf Educ [Internet]. 2015 [cited 2025 Jan 12];29:85-113. Available from: https://www.kci.go.kr/kciportal/landing/article.kci?arti_id=ART001982107
- 13. Zimmerman MA. Psychological empowerment: issues and illustrations. Am J Community Psychol. 1995;23(5):581-599. https://doi.org/10.1007/BF02506983ArticlePubMed
- 14. Gwon BS, Lee JH, Nam HE. Development of independence-mind improvement program for self-sufficient group. J Hum Resour Manag Res [Internet]. 2012 [cited 2025 Jan 12];19(2):187-205. Available from: https://www.kci.go.kr/kciportal/ci/sereArticleSearch/ciSereArtiView.kci?sereArticleSearchBean.artiId=ART001672045
- 15. Hong PY. Toward a client-centered benchmark for self-sufficiency: evaluating the ‘process’ of becoming job ready. J Community Pract. 2013;21(4):356-378. https://doi.org/10.1080/10705422.2013.852147Article
- 16. Ah YA, Kim MH. Study on the effectiveness of a group program to encourage self-reliance in self-reliance project participants. Trans Anal Psychosoc Ther [Internet]. 2011 [cited 2025 Jan 12];8(1):39-59. Available from: https://scholar.kyobobook.co.kr/article/detail/4050025234782
- 17. Kwon MS, Yoon YS, Kim GS. A study on factors which influence the welfare-to-work program participants’ volition of self-support. Korean J Local Gov Admin Stud. 2012;26(3):435-454. https://doi.org/10.18398/kjlgas.2012.26.3.435Article
- 18. Min SY. Service delivery system for the integration of public case management. Soc Welf Policy. 2019;46(2):143-173. https://doi.org/10.15855/swp.2019.46.2.143Article
- 19. Shin W, Shin G. The developmental directions and process of self-sufficiency program in Gyeongnam province: focused on the perception of social workers. J Korean Soc Welf Adm. 2019;21(1):161-188. https://doi.org/10.22944/kswa.2019.21.1.007Article
- 20. Kim KH, Cho S. A study on the factors affecting the education performance of self-sufficiency social worker use for Kirkpatrick education model. Korean J Soc Welf Educ [Internet]. 2017 [cited 2025 Jan 12];38:77-108. Available from: https://www.kci.go.kr/kciportal/ci/sereArticleSearch/ciSereArtiView.kci?sereArticleSearchBean.artiId=ART002243841
- 21. Song IH, Park JH, Kim WS. Relationship among professional support, work hope, and economic self-sufficiency: suggestions for job training center specialist education. Korean J Soc Welf Educ [Internet]. 2013 [cited 2025 Jan 12];22:179-202. Available from: https://www.kci.go.kr/kciportal/ci/sereArticleSearch/ciSereArtiView.kci?sereArticleSearchBean.artiId=ART001785917
- 22. Kwon YS, Lee JS. The effects of the service quality provided by staffs at local self-sufficiency centers on the self-sufficiency performances. J Community Welf. 2011;36:23-49.
- 23. Glasser W. Warning: psychiatry can be hazardous to your mental health. HarperCollins Publishers; 2004. 272 p.
- 24. Nurjanah AS, Sanyata S, Zatrahadi MF. The effectiveness of reality therapy in improving learning motivation and discipline. Psikopedagogia. 2020;9(2):87-91. https://doi.org/10.12928/psikopedagogia.v9i2.19470Article
- 25. Park EK, Baik J. The effects of reality therapy career group counseling on career maturation, career identity, and achievement motivation of juvenile delinquents. Youth Facil Environ [Internet]. 2012 [cited 2025 Jan 12];10(3):67-76. Available from: https://www.kci.go.kr/kciportal/ci/sereArticleSearch/ciSereArtiView.kci?sereArticleSearchBean.artiId=ART001691255
- 26. Kim J, Hyun MS. The effects of a reality therapy program for the elderly with depressive disorder. J East-West Nurs Res. 2016;22(2):96-103. https://doi.org/10.14370/jewnr.2016.22.2.96Article
- 27. Lim JH, Kim HJ. A case study of the art therapy applying reality therapy on self-esteem and marital satisfaction of middle-aged women. Korean J Correct Counsel [Internet]. 2018 [cited 2025 Jan 12];3(1):25-48. Available from: https://scholar.kyobobook.co.kr/article/detail/4050027605652
- 28. Law FM, Guo GJ. The impact of reality therapy on self-efficacy for substance-involved female offenders in Taiwan. Int J Offender Ther Comp Criminol. 2015;59(6):631-653. https://doi.org/10.1177/0306624X13518385ArticlePubMed
- 29. Malekzadeh M, Zoladl M, Movahedi H. The effect of reality therapy on resilience and self-efficacy of prisoners: a randomized controlled trial study. Int J Offender Ther Comp Criminol. 2025;69(13-14):1860-1872. https://doi.org/10.1177/0306624X231188230ArticlePubMed
- 30. Des Jarlais DC, Lyles C, Crepaz N; TREND Group. Improving the reporting quality of nonrandomized evaluations of behavioral and public health interventions: the TREND statement. Am J Public Health. 2004;94(3):361-366. https://doi.org/10.2105/ajph.94.3.361ArticlePubMedPMC
- 31. Cohen J. Statistical power analysis for the behavioral sciences. 2nd ed. Lawrence Erlbaum Associates Publications; 2013. 579 p.
- 32. Choi BM, Hyun MS, Kim JR, Lee HS. Effects of professional capacity enhancement program: a repeated-measure design. In: Proceedings of the 2022 Scientific Meeting of the Korean Society of Nursing Science; 2022 Oct 28; Webinar. Korean Society of Nursing Science; 2022.
- 33. Kim YM. A study on the factors influencing on the effectiveness of the self-efficiency support program: focusing on women participants [master’s thesis]. Seoul: Yonsei University; 2002.
- 34. Rosenberg M. Self-concept from middle childhood through adolescence. In: Suls J, Greenwald AG, editors. Psychological perspectives on the self. Erlbaum; 1986. p. 107-136.
- 35. Lee HJ, Won H. Self-concepts and paranoid tendency. Psychol Sci [Internet]. 1995 [cited 2025 Jan 12];4(2):15-29. Available from: https://scholar.kyobobook.co.kr/article/detail/4010009105071
- 36. Sherer M, Maddux JE, Mercandante B, Prentice-Dunn S, Jacobs B, Rogers RW. The self-efficacy scale: construction and validation. Psychol Rep. 1982;51(2):663-671. https://doi.org/10.2466/pr0.1982.51.2.663Article
- 37. Oh HS. Health promoting behaviors and quality of life of Korean women with arthritis. J Korean Acad Nurs. 1993;23(4):617-630. https://doi.org/10.4040/jnas.1993.23.4.617Article
- 38. Hyun MS, Nam KA, Kim H, Kim JJ. “Returning to an autonomous, ordinary citizenship by standing alone” among low-income people in South Korea: a qualitative study. Curr Psychol. 2024;43:20837-20848. https://doi.org/10.1007/s12144-024-05852-6Article
- 39. Hyun M, Nho D, Park E. Effects of an empowerment program on promoting self-reliance among low-income welfare recipients in Korea: a repeated-measures design. Asian Nurs Res. 2025;19(4):339-346. https://doi.org/10.1016/j.anr.2025.05.004Article
- 40. Wubbolding RE. Reality therapy. 4th ed. Park JH, Kim EJ, translators. Korea Counseling Center; 2023. 242 p.
- 41. Pedersen AB, Mikkelsen EM, Cronin-Fenton D, Kristensen NR, Pham TM, Pedersen L, et al. Missing data and multiple imputation in clinical epidemiological research. Clin Epidemiol. 2017;9:157-166. https://doi.org/10.2147/CLEP.S129785ArticlePubMedPMC
- 42. Faraone SV. Interpreting estimates of treatment effects: implications for managed care. P T. 2008;33(12):700-711. PubMedPMC
- 43. Park JY. The effect of self-sufficiency project on participants’ self-reliance and satisfaction: focusing on self-sufficiency participants in Ulsan Metropolitan City. J Korea Contents Assoc. 2021;21(9):580-594. https://doi.org/10.5392/JKCA.2021.21.09.580Article
- 44. Emirza EG, Bilgili N. The effect of mindfulness-based empowerment program on self-compassion, self-esteem and ways of coping with stress of women experienced violence: a randomised controlled study. Int J Ment Health Nurs. 2024;33(6):2314-2325. https://doi.org/10.1111/inm.13401ArticlePubMed
- 45. Smith L, Tan A, Stephens JD, Hibler D, Duffy SA. Overcoming challenges in multisite trials. Nurs Res. 2019;68(3):227-236. https://doi.org/10.1097/NNR.0000000000000324ArticlePubMed
References
Figure & Data
REFERENCES
Citations
Citations to this article as recorded by 
 ePub Link
 Cite
Cite XML Download
- Figure
-
- We recommend
- Related articles
-
- Effects of a hybrid delirium nursing competency enhancement program using the metaverse and standardized patients for intensive care unit nurses: a quasi-experimental study
- Effects of an integrated healthcare program for postpartum women: a quasi-experimental study
- Effects of an agro-healing program on depression, stress, and cognitive function in older adults: a quasi-experimental study
- Development and effects of a media-based reproductive health promotion program for male high school students at male high school: a quasi-experimental study
Effects of a practitioner-led empowerment program for low-income social service recipients in South Korea: a quasi-experimental study
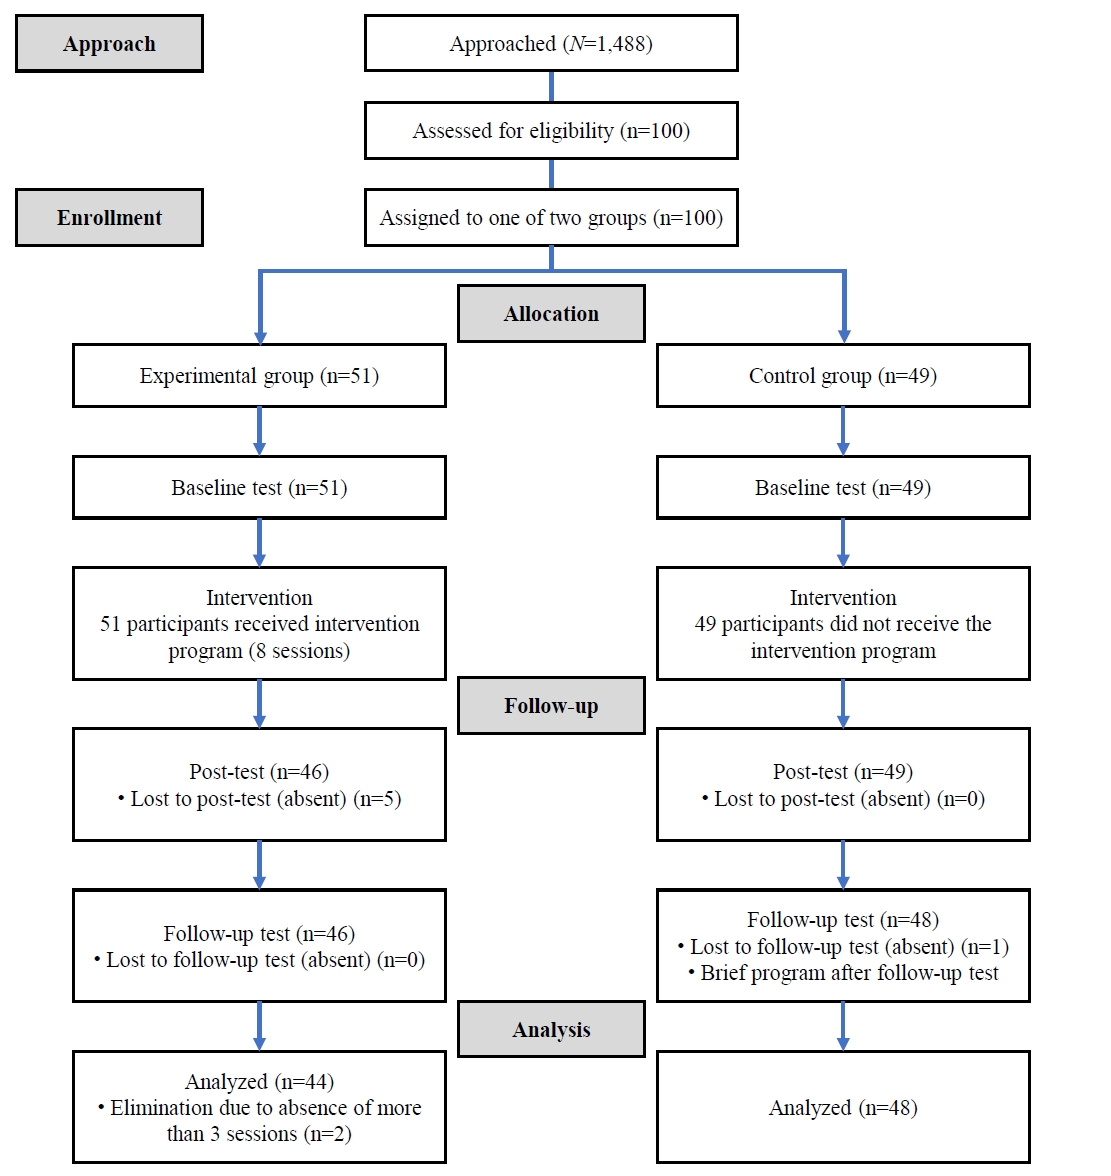
Fig. 1. Participant flowchart of the trial.
Fig. 1.
Effects of a practitioner-led empowerment program for low-income social service recipients in South Korea: a quasi-experimental study
| Stages | Major topics | Session | Specific contents |
|---|---|---|---|
| Creating a counseling environment | Introduction | 1 | • Orientation to the program |
| • Understanding reality therapy | |||
| • Introduction to each other | |||
| Wants | Exploring wants | 2 | • Understanding basic needs |
| • Identifying what I truly want | |||
| • Making new action plans | |||
| 3 | • Finding out why one’s wants aren’t being met | ||
| • Writing down other reasons | |||
| Doing | Understanding “the world I want” and “the world I perceive” | 4 | • Reflecting on “my good photo album” |
| • Reflecting on “the world I perceive” | |||
| • Understanding the conflict arising from the difference between the two worlds | |||
| Exploring one’s behaviors | 5 | • Reflecting on the actions taken to solve the conflict | |
| • Understanding that every action is one’s own choice | |||
| Self-evaluation | Evaluating one’s behaviors and making an action plan | 6 | • Evaluating whether the actions taken helped meet one’s needs |
| • Writing down a behavior one can do differently than before | |||
| Planning | Making plans to become the master of one’s life | 7 | • Trying new behaviors to change one’s life |
| • Improving internal control to change one’s life | |||
| Implementing a plan and strengthening one’s mind | 8 | • Creating a message for continuous plan implementation | |
| • Strengthening one’s mind to become the master of one’s life | |||
| • Closing |
| Characteristic | Total (N=92) | Exp. (n=44) | Cont. (n=48) | t, z, or χ² | p |
|---|---|---|---|---|---|
| Age (yr) | 52.70±10.89 | 52.27±11.55 | 53.08±10.35 | –0.70 |
.944 |
| Gender | 4.19 | .041 | |||
| Men | 38 (41.3) | 23 (52.3) | 15 (31.3) | ||
| Women | 54 (58.7) | 21 (47.7) | 33 (68.7) | ||
| Education | 1.41 |
.723 | |||
| Elementary school | 3 (3.3) | 1 (2.3) | 2 (4.2) | ||
| Middle school | 14 (15.2) | 5 (11.4) | 9 (18.8) | ||
| High school | 59 (64.1) | 30 (68.1) | 29 (60.3) | ||
| College | 16 (17.4) | 8 (18.2) | 8 (16.7) | ||
| Marital status |
3.04 | .385 | |||
| Unmarried | 24 (26.4) | 15 (34.1) | 9 (19.1) | ||
| Separation, divorce | 38 (41.7) | 16 (36.3) | 22 (46.9) | ||
| Married | 16 (17.6) | 8 (18.2) | 8 (17.0) | ||
| Widowed | 13 (14.3) | 5 (11.4) | 8 (17.0) | ||
| Religion | 1.97 | .161 | |||
| Have | 57 (62.0) | 24 (54.5) | 33 (68.7) | ||
| Have not | 35 (38.0) | 20 (45.5) | 15 (31.3) | ||
| Duration of being a recipient (mo) | 14.91±10.81 | 13.05±9.66 | 16.73±11.64 | –1.44 |
.150 |
| Monthly income (10,000 Korean won) | 131.75±25.47 | 132.70±21.72 | 130.90±28.62 | –0.82 |
.414 |
| SS motivation |
30.57±4.29 | 29.57±4.78 | 31.48±3.60 | –2.19 | .029 |
| Self-esteem | 29.05±4.45 | 28.23±4.75 | 29.81±4.05 | –1.73 | .088 |
| Self-efficacy |
61.07±10.16 | 59.11±10.71 | 62.89±9.37 | –1.69 | .092 |
| Variable | T0 | T1 | T2 | T1–T0 | Effect size |
T2–T0 | Effect size |
|---|---|---|---|---|---|---|---|
| Self-sufficiency motivation | 0.45 | 0.82 | |||||
| Exp. (n=44) | 29.57±4.78 | 30.89±4.86 | 30.57±5.07 | 1.32±3.47 | 1.00±3.62 | ||
| Con. (n=48) | 31.48±3.60 | 31.19±4.09 | 29.60±3.61 | –0.29±3.72 | –1.88±3.40 | ||
| Self-esteem | 0.84 | 0.85 | |||||
| Exp. (n=44) | 28.23±4.75 | 30.91±4.86 | 30.61±4.63 | 2.68±3.65 | 2.39±3.79 | ||
| Con. (n=48) | 29.81±4.05 | 29.73±4.59 | 29.42±4.59 | –0.08±2.91 | –0.40±2.76 | ||
| Self-efficacy | 0.61 | 0.71 | |||||
| Exp. (n=44) | 59.11±10.71 | 63.27±10.04 | 62.77±10.54 | 4.16±7.21 | 3.66±6.65 | ||
| Con. (n=48) | 62.89±9.37 | 63.06±9.32 | 62.33±8.40 | 0.21±5.77 | –0.53±5.09 |
| Variable | Unstandardized coefficients (B) | 95% confidence interval | p |
|---|---|---|---|
| Self-sufficiency motivation | |||
| Group | –1.91 | –3.63 to –0.19 | .029 |
| T1 | –0.29 | –1.33 to 0.75 | .583 |
| T2 | –1.88 | –2.83 to –0.92 | <.001 |
| Group×T1 | 1.61 | 0.16 to 3.06 | .030 |
| Group×T2 | 2.88 | 1.45 to 4.30 | <.001 |
| Self-esteem | |||
| Group | –1.59 | –3.38 to 0.21 | .083 |
| T1 | –0.08 | –0.90 to 0.73 | .841 |
| T2 | –0.40 | –1.17 to 0.38 | .315 |
| Group×T1 | 2.77 | 1.43 to 4.11 | <.001 |
| Group×T2 | 2.78 | 1.43 to 4.13 | <.001 |
| Self-efficacy | |||
| Group | –3.78 | –7.88 to 0.32 | .071 |
| T1 | 0.21 | –1.42 to 1.85 | .798 |
| T2 | –0.53 | –1.97 to 0.91 | .469 |
| Group×T1 | 3.95 | 1.28 to 6.61 | .004 |
| Group×T2 | 4.19 | 1.77 to 6.61 | <.001 |
Table 1. Contents of the reality therapy-based empowerment program
Table 2. Homogeneity testing for general characteristics and baseline variables between the two groups (N=92)
Values are presented as mean±standard deviation or number (%). Cont, control group; Exp, experimental group; SS motivation, self-sufficiency motivation. By Mann-Whitney U test. By Fisher’s exact test. Missing data were excluded.
Table 3. Changes in study outcomes over time (N=92)
Values are presented as mean±standard deviation unless otherwise stated. Cont, control group; Exp, experimental group; T0, baseline; T1, post-test; T2, follow-up test; T1–T0, mean difference between baseline and post-test; T2–T0, mean difference between baseline and follow-up test. Effect sizes are presented as absolute values.
Table 4. Results of the generalized estimating equation analysis (N=92)
T0, baseline; T1, post-test; T2, follow-up test; Group×T1, interaction between group and time at post-test; Group×T2, interaction between group and time at follow-up.


