 Submit an article
Articles
- Page Path
- HOME > J Korean Acad Nurs > Volume 56(2); 2026 > Article
-
Research Paper
초등학교 교사의 호흡기 감염예방 행위 구조모형: 횡단적 조사연구 -
이윤지1
 , 이종은2
 - A structural equation model of respiratory infection prevention behaviors among elementary school teachers in South Korea: a cross-sectional study
-
Yoon-Ji Lee1, JONG-EUN LEE2
-
Journal of Korean Academy of Nursing 2026;56(2):262-275.
DOI: https://doi.org/10.4040/jkan.26010
Published online: May 21, 2026
1전주비전대학교 간호학부
2가톨릭대학교 간호대학
1Department of Nursing, VISION College of Jeonju, Jeonju, South Korea
2Department of Health System, College of Nursing, The Catholic University of Korea, Seoul, South Korea
- Corresponding author: JONG-EUN LEE Department of Health System, College of Nursing, The Catholic University of Korea, 222 Banpo-daero, Seocho-gu, Seoul 06591, South Korea E-mail: jlee@catholic.ac.kr
- †This manuscript is a condensed form of the first author’s doctoral dissertation from Catholic University of Korea in 2024.
• Received: January 22, 2026 • Revised: April 29, 2026 • Accepted: April 29, 2026
© 2026 Korean Society of Nursing Science
This is an Open Access article distributed under the terms of the Creative Commons Attribution NoDerivs License (http://creativecommons.org/licenses/by-nd/4.0) If the original work is properly cited and retained without any modification or reproduction, it can be used and re-distributed in any format and medium.
- 719 Views
- 45 Download
Abstract
-
Purpose
- This study aimed to develop and test a structural equation model of respiratory infection prevention behaviors among elementary school teachers based on the Information–Motivation–Behavioral Skills model.
-
Methods
- This study included 250 teachers who were currently working in elementary schools and had experience as homeroom teachers. Data were collected from December 18 to December 31, 2023 using self-reported questionnaires. The proposed model included school organizational culture as the exogenous variable and respiratory infection prevention knowledge, respiratory infection prevention attitude, social support, self-efficacy, and respiratory infection prevention behavior as endogenous variables. Data were analyzed using IBM SPSS for Windows ver. 24.0 and Smart PLS ver. 4.1.
-
Results
- Of the 19 hypothesized paths in the research model, five were statistically significant. School organizational culture had a significant direct effect on respiratory infection prevention knowledge (β=.20, p=.041), social support had a significant direct effect on self-efficacy (β=.33, p=.001), and self-efficacy had a significant direct effect on respiratory infection prevention behaviors (β=.22, p=.021). Respiratory infection prevention attitude (direct: β=.23, p=.029; total: β=.26, p=.008) and school organizational culture (direct: β=.22, p=.017; total: β=.30, p=.002) had significant direct and total effects on respiratory infection prevention behaviors.
-
Conclusion
- To enhance respiratory infection prevention behaviors among elementary school teachers, interventions should focus on strengthening positive attitudes toward infection prevention and improving self-efficacy. Organizational-level strategies, including establishing supportive school organizational cultures, promoting peer support among teachers, and sharing infection prevention practices within schools, are also needed to facilitate and sustain preventive behaviors.
서론
방법
1) 일반적 특성
2) 호흡기 감염예방 지식
3) 호흡기 감염예방 태도
4) 사회적 지지
5) 자기효능감
6) 학교조직문화
7) 호흡기 감염예방 행위
결과
1) 가설적 모형의 적합도 검증
2) 측정모형 평가
고찰
결론
-
Conflicts of Interest
No potential conflict of interest relevant to this article was reported.
-
Acknowledgements
None.
-
Funding
None.
-
Data Sharing Statement
The data collected in this study were obtained under informed consent agreements that explicitly restricted their use to the purposes of the present study only. Accordingly, the data cannot be shared with third parties or used for any purposes beyond those originally specified. Therefore, data sharing is not possible.
-
Supplementary Data
Supplementary data to this article can be found online at https://doi.org/10.4040/jkan.26010.
Supplementary Material 1. Discriminant validity of the measurement model using HTMT (N=250)
-
Author Contributions
Conceptualization: JEL, YJL. Methodology: JEL, YJL. Software: YJL. Validation: JEL, YJL. Formal analysis: YJL. Investigation: YJL. Resources: YJL. Data curation: YJL. Visualization: JEL, YJL. Supervision: JEL. Project administration: JEL. Funding acquisition: YJL. Writing-original draft: JEL, YJL. Writing-review & editing: JEL, YJL. Final approval of the manuscript: all authors.
Article Information

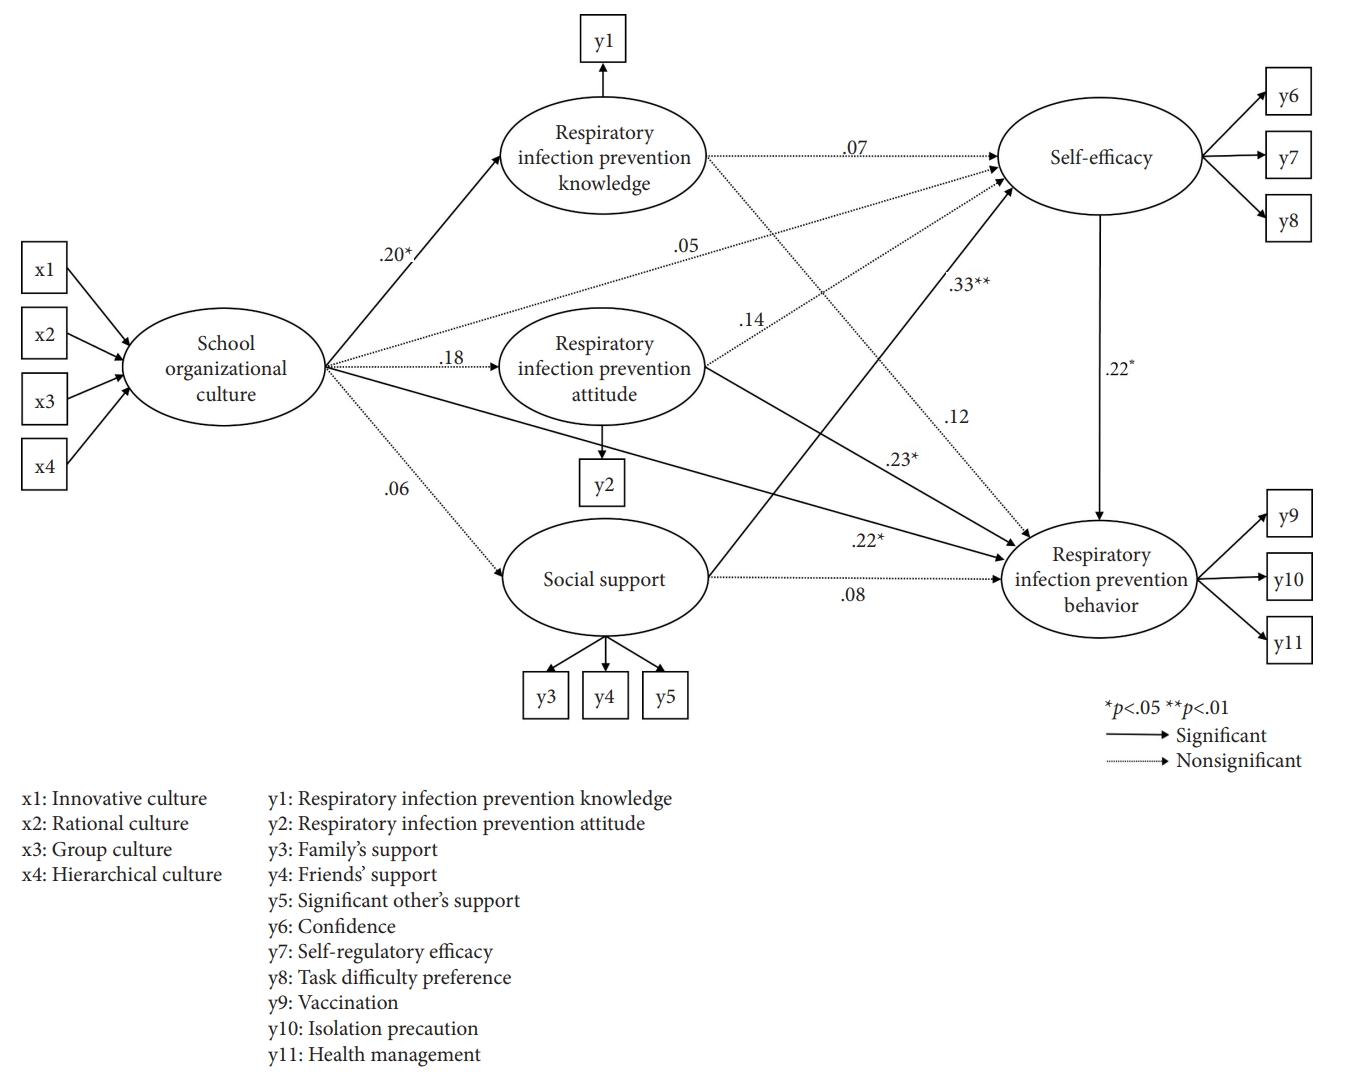
Table 1.General characteristics of participants and characteristics of schools (N=250)
Table 2.Descriptive statistics and validity of research variables (N=250)
Table 3.Direct, indirect, and total effect analysis for the hypothetical model (N=250)
- 1. Kim OS, Yoon SW. Knowledge, compliance, and affecting factors of the cough etiquette to prevent the respiratory infectious disease transmission on convergence study. J Digit Converg. 2018;16(10):389-398. https://doi.org/10.14400/JDC.2018.16.10.389Article
- 2. Calcagni N, Venier AG, Nasso R, Boudin G, Jarrige B, Parneix P, et al. Respiratory infection prevention: perceptions, barriers and facilitators after SARS-CoV-2. Infect Dis Health. 2023;28(1):54-63. https://doi.org/10.1016/j.idh.2022.08.001ArticlePubMedPMC
- 3. Feng N, Luo J, Li H, Zhu N, Feng Q, Li X, et al. Behaviours related to infectious disease and family factors in primary and middle school students. Zhong Nan Da Xue Xue Bao Yi Xue Ban. 2015;40(6):681-687. https://doi.org/10.11817/j.issn.1672-7347.2015.06.018ArticlePubMed
- 4. Jeong D. The concept map on infection disaster response capacity perceived by elementary school teachers: focusing on Corona19 in Daegu. J Korean Educ. 2020;47(3):5-31. https://doi.org/10.22804/jke.2020.47.3.001Article
- 5. Korea Disease Control and Prevention Agency. Rapid spread of influenza epidemic among student age groups [Internet]. Korea Disease Control and Prevention Agency; 2023 [cited 2024 Feb 27]. Available from: https://www.kdca.go.kr/bbs/kdca/42/238814/download.do
- 6. Ministry of Education. COVID-19 response status in education [Internet]. Ministry of Education; 2021 [cited 2024 Feb 27]. Available from: https://www.moe.go.kr/boardCnts/viewRenew.do?boardID=294&boardSeq=89362&lev=0
- 7. Cho AI, Hong SH. Stress vulnerability and stress response of the elementary school teachers. J Educ Innov Res. 2022;32(1):191-221. https://doi.org/10.21024/pnuedi.32.1.202203.191Article
- 8. Fiore AE, Epperson S, Perrotta D, Bernstein H, Neuzil K. Expanding the recommendations for annual influenza vaccination to school-age children in the United States. Pediatrics. 2012;129 Suppl 2:S54-S62. https://doi.org/10.1542/peds.2011-0737CArticlePubMed
- 9. Leventhal H, Zimmerman R, Gutmann M. Compliance: a self-regulation perspective. In: Gentry WD, editor. Handbook of behavioral medicine. Guilford Press; 1984. p. 369-436.
- 10. Kim TH, Park HS, Kim JS. A study on health perception and health promoting lifestyle of the female elementary school teacher. J Korean Acad Soc Nurs Educ. 2005;11(2):191-199.
- 11. Fisher JD, Fisher WA. Changing AIDS-risk behavior. Psychol Bull. 1992;111(3):455-474. https://doi.org/10.1037/0033-2909.111.3.455ArticlePubMed
- 12. Jin H, Kim M. A structural equation model on exercise behavior in patients with heart failure. Korean J Adult Nurs. 2021;33(4):333-348. https://doi.org/10.7475/kjan.2021.33.4.333Article
- 13. Yang C, Lee DT, Chair SY. Validation and adaption of an Information-Motivation-Behavioral Skills model of medication adherence in older patients with multimorbidity. Patient Educ Couns. 2023;113:107756. https://doi.org/10.1016/j.pec.2023.107756ArticlePubMed
- 14. Wang Z, Zhou C, Zhang L, Shen J, Mo M, He Y, et al. Predictors of cancer screening behavior of the working population in China based on the information-motivation-behavioral skills model. Front Public Health. 2023;11:1112172. https://doi.org/10.3389/fpubh.2023.1112172ArticlePubMedPMC
- 15. Ha HJ, Kim EA. A structural equation model on standard precautions compliance of nursing students. Res Community Public Health Nurs. 2022;33(3):321-331. https://doi.org/10.12799/jkachn.2022.33.3.321Article
- 16. Kaiser JL, Hamer DH, Juntunen A, Ngoma T, Fink G, Schueler J, et al. COVID-19 knowledge and prevention behaviors in rural Zambia: a qualitative application of the Information-Motivation-Behavioral Skills model. Am J Trop Med Hyg. 2023;109(1):76-89. https://doi.org/10.4269/ajtmh.22-0604ArticlePubMedPMC
- 17. Fisher WA, Fisher JD, Harman J. The Information-Motivation-Behavioral Skills model: a general social psychological approach to understanding and promoting health behavior. In: Suls J, Wallston KA, editors. Social psychological foundations of health and illness. Wiley-Blackwell; 2003. p. 82-106. https://doi.org/10.1002/9780470753552.ch4
- 18. Fisher JD, Fisher WA. An Information-Motivation-Behavioral Skills (IMB) model of pandemic risk and prevention. Adv Psychol. 2023;1:1-26. https://doi.org/10.56296/aip00004Article
- 19. De Bono S, Heling G, Borg MA. Organizational culture and its implications for infection prevention and control in healthcare institutions. J Hosp Infect. 2014;86(1):1-6. https://doi.org/10.1016/j.jhin.2013.10.007ArticlePubMed
- 20. Kwon MJ, Yi Y. Factors influencing on performance for infection control of nurses working in comprehensive nursing care service ward under COVID-19 pandemic. J Korean Acad Nurs Adm. 2022;28(2):121-130. https://doi.org/10.11111/jkana.2022.28.2.121Article
- 21. Kim JH, Lim KH. Factors influencing performance of infection control in neonatal intensive care units nurses. J Korea Acad Ind Coop Soc. 2023;24(4):477-486. https://doi.org/10.5762/KAIS.2023.24.4.477Article
- 22. Baek SH, Lee MH, Shim MS, Lim HN. The effects of moral sensitivity and organizational culture for infection control on infection control performance of long-term care hospital nurses. J Korean Acad Soc Home Care Nurs. 2023;30(1):26-36. https://doi.org/10.22705/jkashcn.2023.30.1.26Article
- 23. Hanson EM. Educational administration and organizational behavior. Allyn and Bacon; 2003.
- 24. Sinkowitz-Cochran RL, Burkitt KH, Cuerdon T, Harrison C, Gao S, Obrosky DS, et al. The associations between organizational culture and knowledge, attitudes, and practices in a multicenter Veterans Affairs quality improvement initiative to prevent methicillin-resistant Staphylococcus aureus. Am J Infect Control. 2012;40(2):138-143. https://doi.org/10.1016/j.ajic.2011.04.332ArticlePubMed
- 25. Kim J, Park H. The influence of knowledge on standard precautions, nursing professionalism, and organizational culture for infection control on hospital nurses’ performance with guidelines for standard precautions. J Korean Acad Fundam Nurs. 2023;30(2):225-235. https://doi.org/10.7739/jkafn.2022.30.2.225Article
- 26. Yang YJ, Kwon IS. The effects of childcare teachers’ infection prevention knowledge, self-efficacy, and emotional labor on their infection prevention practice. Korean J Child Educ Care [Internet]. 2016 [cited 2024 Feb 27];16(1):79-97. Available from: https://www.kci.go.kr/kciportal/ci/sereArticleSearch/ciSereArtiView.kci?sereArticleSearchBean.artiId=ART002092422
- 27. Kim IO, Park HJ. A survey on the situation, experience and educational need of infectious diseases management of childcare teacher. Korean J Child Educ Care [Internet]. 2014 [cited 2024 Feb 27];14(1):23-50. Available from: https://www.kci.go.kr/kciportal/ci/sereArticleSearch/ciSereArtiView.kci?sereArticleSearchBean.artiId=ART001861255
- 28. Kim JE. Knowledge, attitude, performance of daycare providers for children with special needs on infection prevention. Korean J Early Child Spec Educ. 2016;16(3):77-90. https://doi.org/10.21214/kecse.2016.16.3.77Article
- 29. Lee H, Shin S. Effects of elementary school health teachers' COVID-19 knowledge and resilience on their performance at infection control. J Korean Public Health Nurs. 2021;35(2):297-309. https://doi.org/10.5932/JKPHN.2021.35.2.297Article
- 30. Cho A. A case report of the COVID-19 outbreak response by a middle school health teacher in a mountain village. J Korean Acad Rural Health Nurs. 2021;16(2):54-59. https://doi.org/10.22715/jkarhn.2021.16.2.54Article
- 31. Seo YN, Ha JY. Study on the response status of school communicable diseases for COVID-19 by elementary, middle, and high school health teachers. Glob Health Nurs. 2022;12(2):113-125. https://doi.org/10.35144/ghn.2022.12.2.113Article
- 32. Hong E. Factors affecting the practice of COVID-19 prevention of elementary school staff: focusing on occupational types and COVID-19 related Knowledge. J Korean Soc Sch Health. 2022;35(3):75-83. https://doi.org/10.15434/kssh.2022.35.3.75Article
- 33. Bin SO. Structural relationships of knowledge, perception, attitude and preventive behavior for communicable diseases. J Health Inform Stat [Internet]. 2012 [cited 2024 Feb 27];37(2):57-71. Available from: https://www.kci.go.kr/kciportal/landing/article.kci?arti_id=ART001735417
- 34. Lee CH, An MS, Hurr HY. The relationship between organizational culture and emotional labor: the mediating effect of social support. J Korean Soc Aviat Aeronaut. 2012;20(4):115-125. https://doi.org/10.12985/ksaa.2012.20.4.115Article
- 35. Lee SY. Analysis of the effect of school organizational culture and professional learning communities on teacher efficacy. Integr Educ. 2020;24(2):206-217. https://doi.org/10.15507/1991-9468.099.024.202002.206-217Article
- 36. Yang Y, Kimm H, Jee SH, Hong SH, Han SK. Analysis of the factors related to the infection control practice of 119 emergency medical service providers based on the PRECEDE model. Korean J Emerg Med Serv. 2020;24(1):7-24. https://doi.org/10.14408/KJEMS.2020.24.1.007Article
- 37. Jo HU, Choi EH. The impact of COVID-19 on health prevention behaviors in college students: focusing on the health belief model. J Korean Soc Sch Health. 2021;34(2):115-122. https://doi.org/10.15434/kssh.2021.34.2.115Article
- 38. Ha YS, Choi YM. Impact of organizational culture of early childhood education institutions on the teacher’s turnover intention: the mediation effects of teacher’s resilience and perceived social support. J Korea Open Assoc Early Child Educ. 2022;27(1):139-165. https://doi.org/10.20437/KOAECE27-1-06Article
- 39. Lee E, Kang JH. Influences of COVID-19 knowledge, eHealth literacy, COVID-19 literacy, and social support on COVID-19 preventive behaviors among foreign students in Korea. J Korean Acad Fundam Nurs. 2023;30(2):259-270. https://doi.org/10.7739/jkafn.2022.30.2.259Article
- 40. Sikorska-Simmons E. Organizational culture and work-related attitudes among staff in assisted living. J Gerontol Nurs. 2006;32(2):19-27. https://doi.org/10.3928/0098-9134-20060201-07ArticlePubMed
- 41. Shin GK. Structural equation modeling with SmartPLS 4.0: focusing on master’s and doctoral theses and academic paper writing. rev. ed. Cheong Ram; 2023.
- 42. Hair JF, Ringle CM, Sarstedt M. PLS-SEM: indeed a silver bullet. J Mark Theory Pract. 2011;19(2):139-152. https://doi.org/10.2753/MTP1069-6679190202ArticlePMC
- 43. Choi JS, Kim CG, Park S. The knowledge, awareness and preventive behaviors of pneumococcal vaccination for the elderly. J Korean Acad Community Health Nurs. 2012;23(3):266-275. https://doi.org/10.12799/jkachn.2012.23.3.266Article
- 44. Park YH, Lee SH, Yi YM, Lee CY, Lee MH. Compliance with respiratory infection preventive behaviors and its related factors in older adults using a senior center. J Korean Acad Community Health Nurs. 2018;29(3):322-334. https://doi.org/10.12799/jkachn.2018.29.3.322Article
- 45. Park GS. The study on the health center avian influenza worker’s knowledge, attitude and practical skills about management of avian influenza [master’s thesis]. Gimhae: Inje University; 2006.
- 46. Kim MJ. The convergence study of nursing students’ knowledge, attitudes and preventive behaviors against MERS in South Korea. J Korea Converg Soc. 2017;8(4):149-157. https://doi.org/10.15207/JKCS.2017.8.4.149Article
- 47. Choi YE, Lee ES. A Study on knowledge, attitude, infection management intention & educational needs of new respiratory infectious disease among nurses who unexperienced NRID(SARS & MERS). J Korea Acad Ind Coop Soc. 2019;20(2):721-731. https://doi.org/10.5762/KAIS.2019.20.2.721Article
- 48. Lynn MR. Determination and quantification of content validity. Nurs Res. 1986;35(6):382-385. https://doi.org/10.1097/00006199-198611000-00017ArticlePubMed
- 49. Polit DF, Beck CT, Owen SV. Is the CVI an acceptable indicator of content validity?: appraisal and recommendations. Res Nurs Health. 2007;30(4):459-467. https://doi.org/10.1002/nur.20199ArticlePubMed
- 50. Zimet GD, Dahlem NW, Zimet SG, Farley GK. The multidimensional scale of perceived social support. J Personal Assess. 1988;52(1):30-41. https://doi.org/10.1207/s15327752jpa5201_2ArticlePMC
- 51. Shin JS, Lee YB. The effects of social supports on psychosocial well-being of the unemployed. Korean J Soc Welf. 1999;37:241-269.
- 52. Kim AY. A study on the academic failure: tolerance and its correlates. Korean J Educ Psychol. 1997;11(2):1-19.
- 53. Lee SY. A study on the relationships between school organizational culture, principals' instructional leadership, and teachers’ professional zone of acceptance [dissertation]. Daejeon: Chungnam National University; 1997.
- 54. Jeong WY. Relationship among school organizational culture, teacher efficacy, and school organizational commitment [dissertation]. Incheon: Inha University; 2006.
- 55. Yoon SW, Kim OS. Pregnant women’s knowledge and compliance about prevention of respiratory infection. Korean J Nosocomial Infect Control. 2013;18(1):7-14. https://doi.org/10.14192/kjnic.2013.18.1.7Article
- 56. Kim OS. Knowledge and compliance with prevention of respiratory tract infection among workers in geriatric facilities. Korean J Nosocomial Infect Control. 2015;20(2):61-69. https://doi.org/10.14192/kjnic.2015.20.2.61Article
- 57. Ringle CM, Wende S, Becker JM. SmartPLS 4. SmartPLS GmbH; 2022.
- 58. Hair JF, Hult GT, Ringle CM, Sarstedt M. A primer on partial least squares structural equation modeling. Kim JH, Shim KH, Lee CS, translators. Pncmedia; 2014. p. 342.
- 59. Curran PJ, West SG, Finch JF. The robustness of test statistics to nonnormality and specification error in confirmatory factor analysis. Psychological Methods. 1996;1(1):16-29. https://doi.org/10.1037/1082-989X.1.1.16Article
- 60. Geisser S. A predictive approach to the random effect model. Biometrika. 1974;61(1):101-107. https://doi.org/10.1093/biomet/61.1.101Article
- 61. Stone M. Cross‐validatory choice and assessment of statistical predictions. J R Stat Soc Series B Methodol. 1974;36(2):111-133. https://doi.org/10.1111/j.2517-6161.1974.tb00994.xArticle
- 62. Hu LT, Bentler PM. Fit indices in covariance structure modeling: sensitivity to underparameterized model misspecification. Psychol Methods. 1998;3(4):424-453. https://doi.org/10.1037/1082-989X.3.4.424Article
- 63. Nunnally JC, Bernstein IH. Psychometric theory. McGraw-Hill; 1994.
- 64. Fornell C, Larcker DF. Evaluating structural equation models with unobservable variables and measurement error. J Mark Res. 1981;18(1):39-50. https://doi.org/10.2307/3151312Article
- 65. Henseler J, Ringle CM, Sarstedt M. A new criterion for assessing discriminant validity in variance-based structural equation modeling. J Acad Mark Sci. 2015;43(1):115-135. https://doi.org/10.1007/s11747-014-0403-8Article
- 66. Clark LA, Watson D. Constructing validity: basic issues in objective scale development. Psychol Assess. 1995;7(3):309-319. https://doi.org/10.1037/1040-3590.7.3.309ArticlePMC
- 67. Kline RB. Principles and practice of structural equation modeling. 3rd ed. Guilford Publications; 2011.
- 68. Yim MR, Kim B. Factors affecting infection control performance of school health nurses during the COVID-19 pandemic in South Korea. J Multidiscip Healthc. 2022;15:805-814. https://doi.org/10.2147/JMDH.S356939ArticlePubMedPMC
- 69. Kim H, Park HR. The effects of organizational culture for infection control and self-efficacy on compliance with standard precautions of emergency room nurse. J Korean Biol Nurs Sci. 2019;21(1):46-53. https://doi.org/10.7586/jkbns.2019.21.1.46Article
- 70. Kim Y, Song Y. Organizational culture for infection control and practice of standard precaution in Veterans hospital nurses: the mediating effect of self-efficacy. J Health Inform Stat. 2021;46(1):124-130. https://doi.org/10.21032/jhis.2021.46.1.124Article
- 71. Lim KM, Kim JA. School health teachers’ experience of coping with the COVID-19 pandemic. J Korean Soc Sch Health. 2021;34(1):76-86. https://doi.org/10.15434/kssh.2021.34.1.76Article
- 72. Shrestha R, Altice FL, Huedo-Medina TB, Karki P, Copenhaver M. Willingness to use pre-exposure prophylaxis (PrEP): an empirical test of the Information-Motivation-Behavioral Skills (IMB) model among high-risk drug users in treatment. AIDS Behav. 2017;21(5):1299-1308. https://doi.org/10.1007/s10461-016-1650-0ArticlePubMedPMC
- 73. Kim SO, Sim MS. Fostering sustainable infection prevention behaviors through organizational culture and psychological resources in healthcare settings. Medicine (Baltimore). 2025;104(40):e45013. https://doi.org/10.1097/MD.0000000000045013ArticlePubMedPMC
References
Figure & Data
REFERENCES
Citations
Citations to this article as recorded by 
 ePub Link
 Cite
CiteA structural equation model of respiratory infection prevention behaviors among elementary school teachers in South Korea: a cross-sectional study
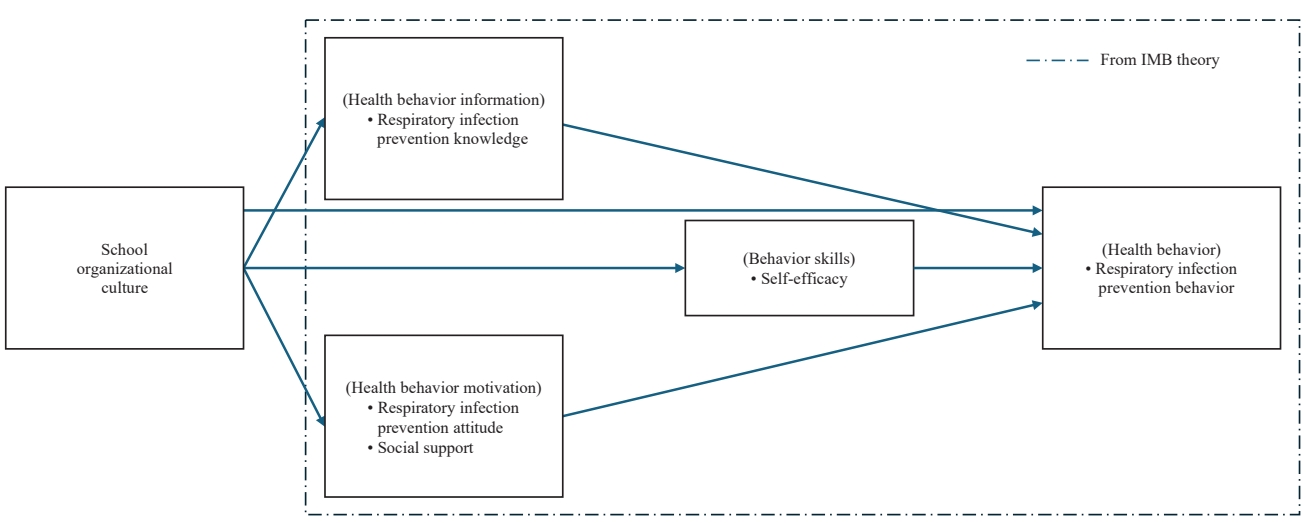

Fig. 1. Conceptual framework. IMB model, Information–Motivation–Behavioral Skills model.
Fig. 2. Hypothetical model. *p<.05. **p<.01.
Fig. 1.
Fig. 2.
A structural equation model of respiratory infection prevention behaviors among elementary school teachers in South Korea: a cross-sectional study
| Characteristic | n (%) | Range | Mean±SD |
|---|---|---|---|
| Participants | |||
| Age (yr) | 24–55 | 35.25±7.36 | |
| 24–29 | 61 (24.4) | ||
| 30–39 | 100 (40.0) | ||
| 40–49 | 71 (28.4) | ||
| ≥50 | 18 (7.2) | ||
| Sex | |||
| Male | 51 (20.4) | ||
| Female | 199 (79.6) | ||
| Cohabiting family | |||
| Yes | 191 (76.4) | ||
| No | 59 (23.6) | ||
| Teaching career (yr) | 1–35 | 10.45±7.06 | |
| ≤5 | 66 (26.4) | ||
| 6–10 | 81 (32.4) | ||
| 11–15 | 57 (22.8) | ||
| ≥16 | 46 (18.4) | ||
| Education experience for infection prevention | |||
| Yes | 162 (64.8) | ||
| No | 88 (35.2) | ||
| Annual education time for infection prevention (hr) | 1–30 | 2.35±4.00 | |
| Participants’ schools | |||
| Location | |||
| Capital region | 141 (56.4) | ||
| Non-capital region | 109 (43.6) | ||
| No. of students in class | 5–37 | 24.88±8.84 | |
| ≤25 | 143 (57.2) | ||
| ≥26 | 107 (42.8) | ||
| No. of total classrooms | 5–60 | 30.68±15.57 | |
| ≤20 | 68 (27.2) | ||
| 21–30 | 72 (28.8) | ||
| 31–40 | 46 (18.4) | ||
| ≥41 | 64 (25.6) | ||
| No. of total teachers | 7–90 | 42.20±19.88 | |
| ≤30 | 73 (29.2) | ||
| 31–50 | 104 (41.6) | ||
| ≥51 | 73 (29.2) |
| Variable | Mean±SD | Min–max | Skewness | Kurtosis | Outer loading (p) | Outer weight (p)a) | CR | AVE | VIF |
|---|---|---|---|---|---|---|---|---|---|
| Respiratory infection prevention knowledge | 7.19±1.70 | 1.00–9.00 | –1.29 | 2.00 | |||||
| Respiratory infection prevention attitude | 3.98±0.51 | 1.40–5.00 | –0.88 | 2.09 | |||||
| Social support | 4.38±0.65 | 2.25–5.00 | –1.32 | 1.42 | .78 | .55 | |||
| Family’s support | 4.44±0.74 | 1.00–5.00 | 1.70 | 3.07 | .83 (<.001) | ||||
| Friends’ support | 4.26±0.81 | 1.50–5.00 | –1.28 | 1.31 | .79 (<.001) | ||||
| Significant others’ support | 4.45±0.85 | 1.00–5.00 | –1.92 | 4.35 | .79 (<.001) | ||||
| Self-efficacy | 4.05±0.68 | 1.92–5.96 | –0.14 | 0.35 | .76 | .52 | |||
| Confidence | 3.75±1.17 | 1.00–5.00 | –0.05 | –0.64 | .62 (.005) | ||||
| Self-regulatory efficacy | 4.64±0.73 | 1.00–5.00 | –0.93 | 2.31 | .91 (<.001) | ||||
| Task difficulty preference | 3.02±1.00 | 1.00–5.00 | –0.01 | –0.59 | .59 (<.001) | ||||
| Respiratory infection prevention behavior | 2.78±0.50 | 1.22–4.00 | 0.12 | –0.14 | .85 | .65 | |||
| Hand hygiene | 3.32±0.50 | 2.00–4.00 | –0.58 | –0.45 | .08 (.652) | ||||
| Vaccination | 2.12±1.07 | 1.00–4.00 | 0.48 | –1.05 | .53 (<.001) | ||||
| Isolation precaution | 2.79±0.64 | 1.00–4.00 | –0.15 | 0.01 | .83 (<.001) | ||||
| Health management | 2.94±0.56 | 1.25–4.00 | 0.01 | –0.35 | .83 (<.001) | ||||
| School organizational culture | 3.11±0.60 | 1.00–5.00 | 0.45 | 0.92 | |||||
| Innovative culture | 3.09±0.98 | 1.00–5.00 | –0.13 | –0.85 | .75 (.008) | .46 (.376) | 2.193 | ||
| Rational culture | 2.90±0.93 | 1.00–5.00 | 0.47 | –0.54 | .78 (.001) | .32 (.374) | 1.620 | ||
| Group culture | 3.21±0.90 | 1.00–5.00 | –0.15 | –0.59 | .62 (.002) | .32 (.333) | 1.925 | ||
| Hierarchical culture | 3.25±0.88 | 1.00–5.00 | 0.03 | –0.72 | .45 (.048) | 1.404 |
| Endogenous variables | Exogenous variables | R2 (adjusted R2) | Q2 | f2 | Direct effects | Indirect effects | Total effects | ||||||
|---|---|---|---|---|---|---|---|---|---|---|---|---|---|
| B | β | t (p) | B | β | t (p) | B | β | t (p) | |||||
| RIPK | SOC | .05 (.04) | .03 | .05 | .22 | .20 | 2.04 (.041) | .22 | .20 | 2.04 (.041) | |||
| RIPA | SOC | .03 (.03) | .01 | .03 | .18 | .18 | 1.53 (.125) | .18 | .18 | 1.53 (.125) | |||
| SS | SOC | .01 (.01) | .01 | .00 | .05 | .06 | 0.50 (.621) | .05 | .06 | 0.50 (.621) | |||
| SE | RIPK | .19 (.18) | .02 | .01 | .08 | .07 | 1.04 (.300) | .08 | .07 | 1.04 (.300) | |||
| SE | RIPA | .02 | .15 | .14 | 1.36 (.175) | .15 | .14 | 1.36 (.175) | |||||
| SE | SS | .12 | .34 | .33 | 3.25 (.001) | .34 | .33 | 3.25 (.001) | |||||
| SE | SOC | .00 | .03 | .05 | 0.24 (.809) | .03 | .03 | 0.46 (.647) | .06 | .08 | 0.35 (.729) | ||
| RIPB | RIPK | .23 (.22) | .05 | .02 | .11 | .12 | 1.81 (.070) | .02 | .02 | 0.86 (.391) | .10 | .10 | 1.53 (.126) |
| RIPB | RIPA | .05 | .22 | .23 | 2.19 (.029) | .03 | .03 | 1.31 (.190) | .25 | .26 | 2.64 (.008) | ||
| RIPB | SS | .01 | .09 | .08 | 0.99 (.324) | .07 | .07 | 1.81 (.070) | .16 | .15 | 2.08 (.037) | ||
| RIPB | SOC | .06 | .22 | .22 | 2.40 (.017) | .08 | .08 | 1.28 (.199) | .30 | .30 | 3.08 (.002) | ||
| RIPB | SE | .05 | .21 | .22 | 2.30 (.021) | .21 | .22 | 2.30 (.021) | |||||
Table 1. General characteristics of participants and characteristics of schools (N=250)
SD, standard deviation.
Table 2. Descriptive statistics and validity of research variables (N=250)
AVE, average variance extracted; CR, composite reliability; SD, standard deviation; VIF, variance inflation factor. a)Outer weight in formative measurement.
Table 3. Direct, indirect, and total effect analysis for the hypothetical model (N=250)
Standardized root mean square residual=.07. RIPA, respiratory infection prevention attitude; RIPB, respiratory infection prevention behavior; RIPK, respiratory infection prevention knowledge; SOC, school organizational culture; SS, social support; SE, self-efficacy.

