 Submit an article
Articles
- Page Path
- HOME > J Korean Acad Nurs > Volume 56(2); 2026 > Article
-
Research Paper
상급종합병원과 종합병원 간호관리자의 직무스트레스와 전문직 삶의 질 관계에서 조직지원인식과 대처방식의 매개효과 -
양서인
 , 최민정
, 최민정 - The mediating effects of perceived organizational support and coping strategies on the relationship between job stress and professional quality of life among nurse managers in tertiary and general hospitals
-
Seo-In Yang, Min-Jung Choi
-
Journal of Korean Academy of Nursing 2026;56(2):166-178.
DOI: https://doi.org/10.4040/jkan.25099
Published online: April 6, 2026
가톨릭대학교 간호대학
College of Nursing, The Catholic University of Korea, Seoul, South Korea
- Corresponding author: Min-Jung Choi College of Nursing, The Catholic University of Korea, 222 Banpo-daero, Seocho-gu, Seoul 06591, South Korea E-mail: genius0527@naver.com
• Received: July 17, 2025 • Revised: January 21, 2026 • Accepted: January 21, 2026
© 2026 Korean Society of Nursing Science
This is an Open Access article distributed under the terms of the Creative Commons Attribution NoDerivs License (http://creativecommons.org/licenses/by-nd/4.0) If the original work is properly cited and retained without any modification or reproduction, it can be used and re-distributed in any format and medium.
- 1,211 Views
- 111 Download
Abstract
-
Purpose
- This study aimed to examine the mediating effects of perceived organizational support and coping strategies on the relationship between job stress and professional quality of life among nurse managers working in tertiary and general hospitals.
-
Methods
- The participants were 299 nurse managers employed at tertiary and general hospitals located in Seoul and Gyeonggi Province. Data on job stress, perceived organizational support, coping strategies, and professional quality of life were collected using an online self-report questionnaire between June 28, 2024, and May 31, 2025. The collected data were analyzed using IBM SPSS Statistics ver. 27.0 and the PROCESS Macro ver. 4.0.
-
Results
- Job stress was identified as a significant predictor of professional quality of life among nurse managers. Perceived organizational support and active coping demonstrated significant mediating effects on compassion satisfaction. Active coping showed a significant mediating effect on burnout, whereas perceived organizational support mediated secondary traumatic stress. Passive coping did not demonstrate a significant mediating effect on any of the three subdomains of professional quality of life.
-
Conclusion
- Job stress is closely associated with compassion satisfaction, and this relationship is partially mediated by perceived organizational support and active coping. Accordingly, targeted interventions are required to reduce job stress, strengthen organizational support, and enhance coping competencies among nurse managers. Furthermore, reinforcing institutional- and policy-level support is essential to mitigate secondary traumatic stress and to ensure the sustainability of nurse managers’ professional roles.
서론
방법
1) 일반적 특성
2) 직무스트레스
3) 조직지원인식
4) 대처방식
5) 전문직 삶의 질
결과
고찰
결론
-
Conflicts of Interest
No potential conflict of interest relevant to this article was reported.
-
Acknowledgements
None.
-
Funding
This research received no external funding.
-
Data Sharing Statement
Please contact the corresponding author for data availability.
-
Supplementary Data
Supplementary data to this article can be found online at https://doi.org/10.4040/jkan.25099.
-
Author Contributions
Conceptualization: SIY, MJC. Data curation: SIY, MJC. Formal analysis: SIY, MJC. Funding acquisition: none. Investigation: SIY. Methodology: SIY, MJC. Project administration: MJC. Resources: SIY. Software: SIY. Supervision: MJC. Validation: SIY, MJC. Visualization: SIY. Writing–original draft: SIY, MJC. Writing–review & editing: SIY, MJC.
Article Information
Fig. 1.Mediating effects of perceived organizational support and coping in the relationship between job stress and professional quality of life. (A–C) Conceptual framework of the mediating model. (D–F) Statistical model of the mediating effect. (A, D) Compassion satisfaction; (B, E) Burnout; (C, F) Secondary traumatic stress. AC, active coping; BO, burnout; c, total effect; c', direct effect; CS, compassion satisfaction; JS, job stress; PC, passive coping; POS, perceived organizational support; STS, secondary traumatic stress. *p<.05. **p<.001.

Table 1.Differences in professional quality of life according to participants’ general characteristics (N=299)
| Characteristic | n (%) or mean±SD | Professional quality of life | ||||||||
|---|---|---|---|---|---|---|---|---|---|---|
| Compassion satisfaction | Burnout | Secondary traumatic stress | ||||||||
| Mean±SD | t or F (Z) | p | Mean±SD | t or F (Z) | p | Mean±SD | t or F (Z) | p | ||
| Age (yr) | 2.79 | .063 | 6.49 | .002 | 0.14 | .870 | ||||
| <45 | 77 (25.7) | 3.59±0.72 | 2.85±0.64b | a>b | 2.63±0.65 | |||||
| 45–49 | 104 (34.8) | 3.61±0.53 | 2.79±0.47b | 2.66±0.68 | ||||||
| ≥50 | 118 (39.5) | 3.77±0.58 | 2.60±0.47a | 2.68±0.61 | ||||||
| Mean±SD | 47.98±5.06 | |||||||||
| Gender | –1.03a) | .303 | 0.71a) | .481 | –2.66a) | .008 | ||||
| Men | 7 (2.3) | 3.47±0.51 | 2.87±0.69 | 2.06±0.52 | ||||||
| Women | 292 (97.7) | 3.67±0.61 | 2.73±0.53 | 2.68±0.64 | ||||||
| Marital status | –3.29 | .001 | –3.90 | <.001 | 1.12 | .263 | ||||
| Unmarried | 40 (13.4) | 3.38±0.61 | 3.03±0.57 | 2.77±0.57 | ||||||
| Married | 259 (86.6) | 3.71±0.59 | 2.68±0.51 | 2.65±0.65 | ||||||
| Religion | 2.39 | .018 | –2.36 | .019 | 0.45 | .653 | ||||
| Yes | 183 (61.2) | 3.73±0.59 | 2.67±0.54 | 2.67±0.64 | ||||||
| No | 116 (38.8) | 3.56±0.61 | 2.82±0.50 | 2.64±0.65 | ||||||
| Education level | –3.54 | <.001 | 2.34 | .020 | –0.22 | .828 | ||||
| Bachelor’s or below | 43 (14.4) | 3.37±0.69 | 2.90±0.50 | 2.64±0.63 | ||||||
| Master’s or above | 256 (85.6) | 3.72±0.58 | 2.70±0.53 | 2.66±0.64 | ||||||
| Hospital type | –1.10 | .273 | 1.74 | .083 | 1.47 | .142 | ||||
| General hospital | 126 (42.1) | 3.62±0.63 | 2.79±0.51 | 2.73±0.64 | ||||||
| Tertiary hospital | 173 (57.9) | 3.70±0.59 | 2.68±0.54 | 2.62±0.64 | ||||||
| Working unit | 2.79 | .063 | 6.34 | .002 | 4.05 | .018 | ||||
| General ward | 159 (53.2) | 3.61±0.61 | 2.80±0.52a | a>b | 2.75±0.64a | a>b | ||||
| Specialized unit | 83 (27.8) | 3.69±0.64 | 2.74±0.54a | 2.61±0.67ab | ||||||
| Outpatient/others | 57 (19.0) | 3.82±0.51 | 2.51±0.48b | 2.49±0.58b | ||||||
| Nursing experience (yr) | 5.56 | .001 | 6.67 | <.001 | 0.24 | .871 | ||||
| <20 | 53 (17.7) | 3.40±0.84b | a>b | 2.90±0.67a | a>b | 2.61±0.65 | ||||
| 20–25 | 86 (28.8) | 3.69±0.49a | 2.79±0.52a | 2.70±0.65 | ||||||
| 25–30 | 90 (30.1) | 3.67±0.56ab | 2.74±0.41ab | 2.68±0.61 | ||||||
| ≥30 | 70 (23.4) | 3.84±0.51a | 2.51±0.50b | 2.64±0.68 | ||||||
| Managerial experience (yr) | 3.46 | .017 | 3.61 | .014 | 0.22 | .880 | ||||
| <2 | 46 (15.4) | 3.51±0.75a | 2.84±0.61a | 2.64±0.61 | ||||||
| 2–5 | 78 (26.1) | 3.55±0.65a | 2.84±0.51a | 2.71±0.68 | ||||||
| 5–10 | 93 (31.1) | 3.74±0.53a | 2.70±0.51a | 2.65±0.64 | ||||||
| ≥10 | 82 (27.4) | 3.78±0.52a | 2.60±0.49a | 2.63±0.64 | ||||||
| No. of staff nurses supervised | 0.36 | .701 | 0.27 | .762 | 0.25 | .780 | ||||
| <20 | 89 (29.8) | 3.67±0.60 | 2.69±0.52 | 2.62±0.63 | ||||||
| 20–40 | 140 (46.8) | 3.64±0.61 | 2.74±0.52 | 2.68±0.65 | ||||||
| ≥40 | 70 (23.4) | 3.72±0.61 | 2.74±0.56 | 2.67±0.64 | ||||||
| Subjective health status | 10.76 | <.001 | 22.80 | <.001 | 5.29 | .006 | ||||
| Good | 91 (30.4) | 3.87±0.50a | a>b>c | 2.49±0.47c | a>b>c | 2.50±0.67b | a>b | |||
| Moderate | 158 (52.9) | 3.63±0.59b | 2.76±0.49b | 2.69±0.61ab | ||||||
| Poor | 50 (16.7) | 3.41±0.72c | 3.06±0.56a | 2.85±0.64a | ||||||
| Working hours (hr/wk) | 0.71 | .493 | 4.25 | .015 | 1.57 | .211 | ||||
| ≤40 | 105 (35.1) | 3.71±0.62 | 2.63±0.50b | a>b | 2.59±0.67 | |||||
| 41–50 | 145 (48.5) | 3.67±0.56 | 2.75±0.54ab | 2.67±0.60 | ||||||
| ≥51 | 49 (16.4) | 3.58±0.71 | 2.89±0.52a | 2.79±0.70 | ||||||
Table 2.Levels of job stress, perceived organizational support, coping strategies, and professional quality of life (N=299)
Table 3.Correlations among the variables (N=299)
Table 4.Effects of job stress on compassion satisfaction, burnout, and secondary traumatic stress: the mediating effects of perceived organizational support and coping (N=299)
Control variables: Compassion satisfaction: marital status, religion, education level, nursing experience, managerial experience, subjective health status; Burnout: age, marital status, religion, education level, working unit, nursing experience, managerial experience, subjective health status, working hours; Secondary traumatic stress: working unit, subjective health status.
Boot CI, bootstrapped confidence interval; Boot SE, bootstrapped standard error; CI, confidence interval; M1, perceived organizational support; M2, active coping; M3, passive coping; R2, coefficient of determination; SE, standard error; X, job stress; Y1, compassion satisfaction; Y2, burnout; Y3, secondary traumatic stress.
- 1. Sveinsdóttir H, Blöndal K, Jónsdóttir HH, Bragadóttir H. The content of nurse unit managers’ work: a descriptive study using daily activity diaries. Scand J Caring Sci. 2018;32(2):861-870. https://doi.org/10.1111/scs.12517ArticlePubMed
- 2. Niinihuhta M, Terkamo-Moisio A, Kvist T, Häggman-Laitila A. A comprehensive evaluation of factors affecting nurse leaders’ work-related well-being. Leadersh Health Serv (Bradf Engl). 2022;35(3):460-474. https://doi.org/10.1108/LHS-12-2021-0098ArticlePubMedPMC
- 3. World Health Organization (WHO). State of the world’s nursing 2020: investing in education, jobs and leadership [Internet]. WHO; 2020 [cited 2025 Sep 22]. Available from: https://www.who.int/publications/i/item/9789240003279
- 4. Buchan J, Catton H. Recover to rebuild: investing in the nursing workforce for health system effectiveness [Internet]. International Council of Nurses; 2023 [cited 2025 Sep 22]. Available from: https://www.icn.ch/sites/default/files/2023-07/ICN_Recover-to-Rebuild_report_EN.pdf
- 5. Membrive-Jiménez MJ, Velando-Soriano A, Pradas-Hernandez L, Gomez-Urquiza JL, Romero-Béjar JL, Cañadas-De la Fuente GA, et al. Prevalence, levels and related factors of burnout in nurse managers: a multi-centre cross-sectional study. J Nurs Manag. 2022;30(4):954-961. https://doi.org/10.1111/jonm.13575ArticlePubMedPMC
- 6. Labrague LJ, McEnroe-Petitte DM, Leocadio MC, Van Bogaert P, Cummings GG. Stress and ways of coping among nurse managers: an integrative review. J Clin Nurs. 2018;27(7-8):1346-1359. https://doi.org/10.1111/jocn.14165ArticlePubMed
- 7. Remegio W, Rivera RR, Griffin MQ, Fitzpatrick JJ. The professional quality of life and work engagement of nurse leaders. Nurse Lead. 2021;19(1):95-100. https://doi.org/10.1016/j.mnl.2020.08.001ArticlePubMedPMC
- 8. Bunch JL, Gedney-Lose A, Perkhounkova Y, Sharp B, Groves PS. Nurse managers’ professional quality of life during the COVID-19 pandemic. West J Nurs Res. 2024;46(3):183-191. https://doi.org/10.1177/01939459241227264ArticlePubMed
- 9. Adriaenssens J, Hamelink A, Bogaert PV. Predictors of occupational stress and well-being in First-Line Nurse Managers: a cross-sectional survey study. Int J Nurs Stud. 2017;73:85-92. https://doi.org/10.1016/j.ijnurstu.2017.05.007ArticlePubMed
- 10. Stamm BH. The concise manual for the professional quality of life scale [Internet]. ProQol; 2010 [cited 2018 Nov 20]. Available from: https://proqol.org/proqol-manual
- 11. Ruiz-Fernández MD, Ramos-Pichardo JD, Ibáñez-Masero O, Carmona-Rega MI, Sánchez-Ruiz MJ, Ortega-Galán ÁM. Professional quality of life, self-compassion, resilience, and empathy in healthcare professionals during COVID-19 crisis in Spain. Res Nurs Health. 2021;44(4):620-632. https://doi.org/10.1002/nur.22158ArticlePubMedPMC
- 12. Kelly LA, Lefton C, Fischer SA. Nurse leader burnout, satisfaction, and work-life balance. J Nurs Adm. 2019;49(9):404-410. https://doi.org/10.1097/NNA.0000000000000784ArticlePubMedPMC
- 13. Luo D, Song Y, Cai X, Li R, Bai Y, Chen B, et al. Nurse managers’ burnout and organizational support: the serial mediating role of leadership and resilience. J Nurs Manag. 2022;30(8):4251-4261. https://doi.org/10.1111/jonm.13852ArticlePubMed
- 14. Speroni KG, Antol S, Lisle L, Aroom W. Differences by nurse type in professional quality of life perceptions from pre-COVID-19 to intra-COVID-19. Online J Issues Nurs. 2023;28(3):1-11. https://doi.org/10.3912/OJIN.Vol28No03PPT75Article
- 15. Rhoades L, Eisenberger R. Perceived organizational support: a review of the literature. J Appl Psychol. 2002;87(4):698-714. https://doi.org/10.1037/0021-9010.87.4.698ArticlePubMed
- 16. Zheng J, Feng S, Gao R, Gong X, Ji X, Li Y, et al. The relationship between organizational support, professional quality of life, decent work, and professional well-being among nurses: a cross-sectional study. BMC Nurs. 2024;23(1):425. https://doi.org/10.1186/s12912-024-02114-5ArticlePubMedPMC
- 17. Ren Y, Li G, Pu D, He L, Huang X, Lu Q, et al. The relationship between perceived organizational support and burnout in newly graduated nurses from southwest China: the chain mediating roles of psychological capital and work engagement. BMC Nurs. 2024;23(1):719. https://doi.org/10.1186/s12912-024-02386-xArticlePubMedPMC
- 18. Tang Y, Wang Y, Zhou H, Wang J, Zhang R, Lu Q. The relationship between psychiatric nurses’ perceived organizational support and job burnout: mediating role of psychological capital. Front Psychol. 2023;14:1099687. https://doi.org/10.3389/fpsyg.2023.1099687ArticlePubMedPMC
- 19. Eisenberger R, Huntington R, Hutchison S, Sowa D. Perceived organizational support. J Appl Psychol. 1986;71(3):500-507. https://doi.org/10.1037//0021-9010.71.3.500Article
- 20. Lazarus RS, Folkman S. Stress, appraisal, and coping. Springer Publishing Company; 1984. p. 1913-1915.
- 21. Carver CS, Scheier MF, Weintraub JK. Assessing coping strategies: a theoretically based approach. J Pers Soc Psychol. 1989;56(2):267-283. https://doi.org/10.1037//0022-3514.56.2.267ArticlePubMedPMC
- 22. Jiao R, Li J, Cheng N, Liu X, Tan Y. The mediating role of coping styles between nurses’ workplace bullying and professional quality of life. BMC Nurs. 2023;22(1):459. https://doi.org/10.1186/s12912-023-01624-yArticlePubMedPMC
- 23. Lim H. The impact of job stress on the professional quality of life of hospital nurses and the moderating effect of empathy competence [dissertation]. Gimhae: Inje University; 2018.
- 24. Shin M, Joung W. Effects of job stress, social support, and infection control fatigue on professional quality of life among nurses in designated COVID-19 hospitals. J Korean Acad Nurs Adm. 2023;29(5):603-613. https://doi.org/10.11111/jkana.2023.29.5.603Article
- 25. Lee YB, Lee HK. The convergence factors of nursing organizational culture on the nurses’ professional quality of life. J Korea Converg Soc. 2018;9(11):491-500. https://doi.org/10.15207/JKCS.2018.9.11.491Article
- 26. Chang SJ, Koh SB, Kang D, Kim SA, Kang MG, Lee CG, et al. Developing an occupational stress scale for Korean employees. Korean J Occup Environ Med. 2005;17(4):297-317. https://doi.org/10.35371/kjoem.2005.17.4.297Article
- 27. Woo TG, Kim MJ, Kwon KH. The effects of knowledge sharing and work engagement on innovative behavior: focused on the moderating effect of perceived organizational support. J Hum Resour Manag Res. 2019;26(4):105-128. https://doi.org/10.14396/jhrmr.2019.26.4.105Article
- 28. Kim JH, Lee JH. Components of coping strategies and their relationship with depression. J Behav Sci [Internet]. 1985 [cited 2025 Sep 22];7(1):127-138. Available from: https://kiss.kstudy.com/Detail/Ar?key=1645863
- 29. Park JY. A study on the relationship among type A and B ego-identity and stress coping [dissertation]. Seoul: Sookmyung Women’s University; 1995.
- 30. Kim SH, Lee TW. Study of the relationship between compassion fatigue, somatization and silencing response among hospital nurses: focusing on the mediating effects of silencing response. Korean J Adult Nurs. 2014;26(3):362-371. https://doi.org/10.7475/kjan.2014.26.3.362Article
- 31. Hayes AF. Introduction to mediation, moderation, and conditional process analysis: a regression-based approach. 2nd ed. Guilford Publications; 2017. 732 p.
- 32. Kline RB. Data screening and assumptions. In: Kline RB, editor. Principles and practice of structural equation modeling. 4th ed. Guilford Publications; 2016. p. 63-96.
- 33. Hair JF, Black WC, Babin BJ, Anderson RE. Multivariate data analysis. 8th ed. Cengage Learning; 2019. 813 p.
- 34. Cybulska AM, Żołnowska MA, Schneider-Matyka D, Nowak M, Starczewska M, Grochans S, et al. Analysis of nurses’ attitudes toward patient death. Int J Environ Res Public Health. 2022;19(20):13119. https://doi.org/10.3390/ijerph192013119ArticlePubMedPMC
- 35. Udod S, Cummings GG, Care WD, Jenkins M. Role stressors and coping strategies among nurse managers. Leadersh Health Serv (Bradf Engl). 2017;30(1):29-43. https://doi.org/10.1108/LHS-04-2016-0015ArticlePubMed
- 36. Shan Y, Zhou X, Zhang Z, Chen W, Chen R. Enhancing the work engagement of frontline nurses during the COVID-19 pandemic: the mediating role of affective commitment and perceived organizational support. BMC Nurs. 2023;22(1):451. https://doi.org/10.1186/s12912-023-01623-zArticlePubMedPMC
- 37. Lee HF, Kuo CC, Chien TW, Wang YR. A meta-analysis of the effects of coping strategies on reducing nurse burnout. Appl Nurs Res. 2016;31:100-110. https://doi.org/10.1016/j.apnr.2016.01.001ArticlePubMed
- 38. Jin F, Ni S, Wang L. Occupational stress, coping strategies, and mental health among clinical nurses in hospitals: a mediation analysis. Front Public Health. 2025;13:1537120. https://doi.org/10.3389/fpubh.2025.1537120ArticlePubMedPMC
- 39. Ha DG, Sung MH. Impact of job stress, coping behavior, hardiness on burnout in nurses in the emergency department. Korean J Occup Health Nurs. 2018;27(4):215-223. https://doi.org/10.5807/kjohn.2018.27.4.215Article
- 40. Ceravolo D, Raines DA. The impact of a mindfulness intervention for nurse managers. J Holist Nurs. 2019;37(1):47-55. https://doi.org/10.1177/0898010118781620ArticlePubMed
- 41. Dou J, Lian Y, Lin L, Asmuri SN, Wang P, Rajen Durai RA. Effectiveness of mindfulness-based interventions on burnout, resilience and sleep quality among nurses: a systematic review and meta-analysis of randomized controlled trials. BMC Nurs. 2025;24(1):739. https://doi.org/10.1186/s12912-025-03101-0ArticlePubMedPMC
- 42. Zhang JY, Du RN, Wang ZR, Chen JX, Chen N, Zhao J, et al. The relationship between perceived organizational support and insomnia in psychiatric nurses in China: the mediating role of psychological capital. BMC Nurs. 2025;24(1):915. https://doi.org/10.1186/s12912-025-03554-3ArticlePubMedPMC
References
Figure & Data
REFERENCES
Citations
Citations to this article as recorded by 
 ePub Link
 Cite
CiteThe mediating effects of perceived organizational support and coping strategies on the relationship between job stress and professional quality of life among nurse managers in tertiary and general hospitals
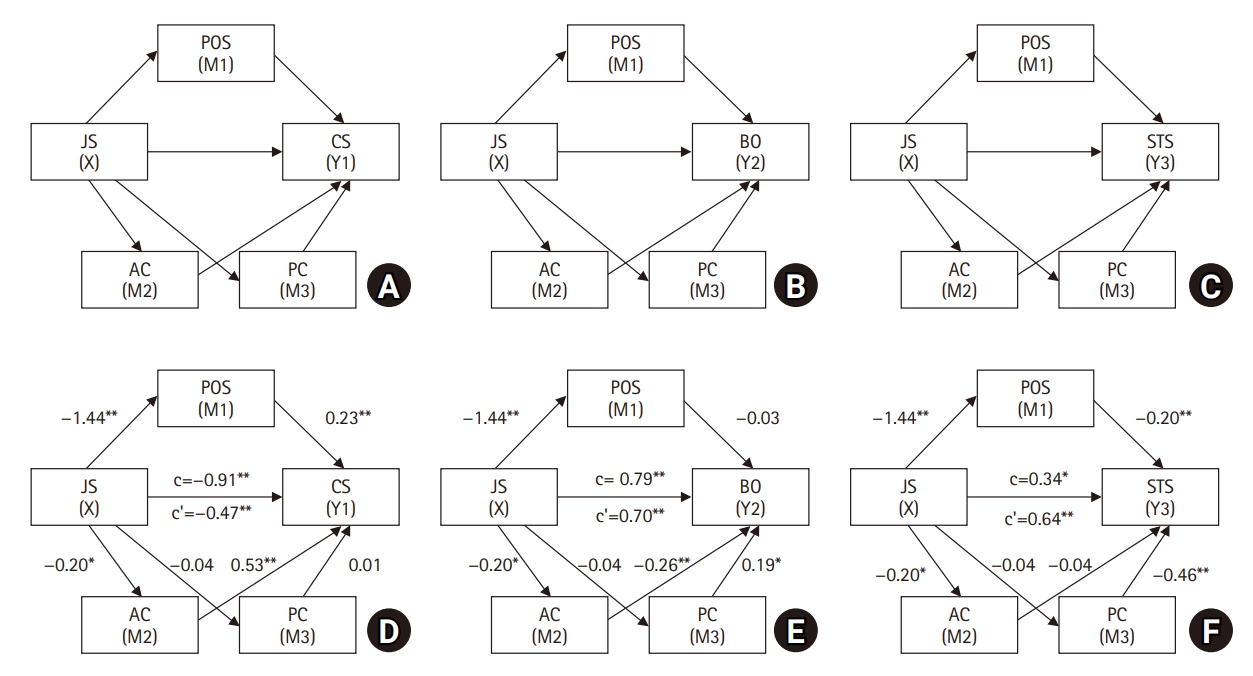
Fig. 1. Mediating effects of perceived organizational support and coping in the relationship between job stress and professional quality of life. (A–C) Conceptual framework of the mediating model. (D–F) Statistical model of the mediating effect. (A, D) Compassion satisfaction; (B, E) Burnout; (C, F) Secondary traumatic stress. AC, active coping; BO, burnout; c, total effect; c', direct effect; CS, compassion satisfaction; JS, job stress; PC, passive coping; POS, perceived organizational support; STS, secondary traumatic stress. *p<.05. **p<.001.
Fig. 1.
The mediating effects of perceived organizational support and coping strategies on the relationship between job stress and professional quality of life among nurse managers in tertiary and general hospitals
| Characteristic | n (%) or mean±SD | Professional quality of life | ||||||||
|---|---|---|---|---|---|---|---|---|---|---|
| Compassion satisfaction | Burnout | Secondary traumatic stress | ||||||||
| Mean±SD | t or F (Z) | p | Mean±SD | t or F (Z) | p | Mean±SD | t or F (Z) | p | ||
| Age (yr) | 2.79 | .063 | 6.49 | .002 | 0.14 | .870 | ||||
| <45 | 77 (25.7) | 3.59±0.72 | 2.85±0.64 |
a>b | 2.63±0.65 | |||||
| 45–49 | 104 (34.8) | 3.61±0.53 | 2.79±0.47 |
2.66±0.68 | ||||||
| ≥50 | 118 (39.5) | 3.77±0.58 | 2.60±0.47 |
2.68±0.61 | ||||||
| Mean±SD | 47.98±5.06 | |||||||||
| Gender | –1.03 |
.303 | 0.71 |
.481 | –2.66 |
.008 | ||||
| Men | 7 (2.3) | 3.47±0.51 | 2.87±0.69 | 2.06±0.52 | ||||||
| Women | 292 (97.7) | 3.67±0.61 | 2.73±0.53 | 2.68±0.64 | ||||||
| Marital status | –3.29 | .001 | –3.90 | <.001 | 1.12 | .263 | ||||
| Unmarried | 40 (13.4) | 3.38±0.61 | 3.03±0.57 | 2.77±0.57 | ||||||
| Married | 259 (86.6) | 3.71±0.59 | 2.68±0.51 | 2.65±0.65 | ||||||
| Religion | 2.39 | .018 | –2.36 | .019 | 0.45 | .653 | ||||
| Yes | 183 (61.2) | 3.73±0.59 | 2.67±0.54 | 2.67±0.64 | ||||||
| No | 116 (38.8) | 3.56±0.61 | 2.82±0.50 | 2.64±0.65 | ||||||
| Education level | –3.54 | <.001 | 2.34 | .020 | –0.22 | .828 | ||||
| Bachelor’s or below | 43 (14.4) | 3.37±0.69 | 2.90±0.50 | 2.64±0.63 | ||||||
| Master’s or above | 256 (85.6) | 3.72±0.58 | 2.70±0.53 | 2.66±0.64 | ||||||
| Hospital type | –1.10 | .273 | 1.74 | .083 | 1.47 | .142 | ||||
| General hospital | 126 (42.1) | 3.62±0.63 | 2.79±0.51 | 2.73±0.64 | ||||||
| Tertiary hospital | 173 (57.9) | 3.70±0.59 | 2.68±0.54 | 2.62±0.64 | ||||||
| Working unit | 2.79 | .063 | 6.34 | .002 | 4.05 | .018 | ||||
| General ward | 159 (53.2) | 3.61±0.61 | 2.80±0.52 |
a>b | 2.75±0.64 |
a>b | ||||
| Specialized unit | 83 (27.8) | 3.69±0.64 | 2.74±0.54 |
2.61±0.67 |
||||||
| Outpatient/others | 57 (19.0) | 3.82±0.51 | 2.51±0.48 |
2.49±0.58 |
||||||
| Nursing experience (yr) | 5.56 | .001 | 6.67 | <.001 | 0.24 | .871 | ||||
| <20 | 53 (17.7) | 3.40±0.84 |
a>b | 2.90±0.67 |
a>b | 2.61±0.65 | ||||
| 20–25 | 86 (28.8) | 3.69±0.49 |
2.79±0.52 |
2.70±0.65 | ||||||
| 25–30 | 90 (30.1) | 3.67±0.56 |
2.74±0.41 |
2.68±0.61 | ||||||
| ≥30 | 70 (23.4) | 3.84±0.51 |
2.51±0.50 |
2.64±0.68 | ||||||
| Managerial experience (yr) | 3.46 | .017 | 3.61 | .014 | 0.22 | .880 | ||||
| <2 | 46 (15.4) | 3.51±0.75 |
2.84±0.61 |
2.64±0.61 | ||||||
| 2–5 | 78 (26.1) | 3.55±0.65 |
2.84±0.51 |
2.71±0.68 | ||||||
| 5–10 | 93 (31.1) | 3.74±0.53 |
2.70±0.51 |
2.65±0.64 | ||||||
| ≥10 | 82 (27.4) | 3.78±0.52 |
2.60±0.49 |
2.63±0.64 | ||||||
| No. of staff nurses supervised | 0.36 | .701 | 0.27 | .762 | 0.25 | .780 | ||||
| <20 | 89 (29.8) | 3.67±0.60 | 2.69±0.52 | 2.62±0.63 | ||||||
| 20–40 | 140 (46.8) | 3.64±0.61 | 2.74±0.52 | 2.68±0.65 | ||||||
| ≥40 | 70 (23.4) | 3.72±0.61 | 2.74±0.56 | 2.67±0.64 | ||||||
| Subjective health status | 10.76 | <.001 | 22.80 | <.001 | 5.29 | .006 | ||||
| Good | 91 (30.4) | 3.87±0.50 |
a>b>c | 2.49±0.47 |
a>b>c | 2.50±0.67 |
a>b | |||
| Moderate | 158 (52.9) | 3.63±0.59 |
2.76±0.49 |
2.69±0.61 |
||||||
| Poor | 50 (16.7) | 3.41±0.72 |
3.06±0.56 |
2.85±0.64 |
||||||
| Working hours (hr/wk) | 0.71 | .493 | 4.25 | .015 | 1.57 | .211 | ||||
| ≤40 | 105 (35.1) | 3.71±0.62 | 2.63±0.50 |
a>b | 2.59±0.67 | |||||
| 41–50 | 145 (48.5) | 3.67±0.56 | 2.75±0.54 |
2.67±0.60 | ||||||
| ≥51 | 49 (16.4) | 3.58±0.71 | 2.89±0.52 |
2.79±0.70 | ||||||
| Variable | Range | Mean±SD | Min–Max | Skewness | Kurtosis | |
|---|---|---|---|---|---|---|
| Job stress | 1–4 | 2.28±0.32 | 1.42–3.25 | 0.28 | 0.31 | |
| Perceived organizational support | 1–5 | 2.88±0.73 | 1.00–4.43 | –0.41 | –0.27 | |
| Active coping | 1–4 | 3.01±0.56 | 1.83–3.92 | –0.14 | 0.27 | |
| Passive coping | 1–4 | 2.52±0.37 | 1.00–3.50 | –0.46 | 1.04 | |
| Compassion satisfaction | 1–5 | 3.68±0.60 | 1.00–4.90 | –0.62 | 1.79 | |
| Burnout | 1–5 | 2.50±0.49 | 1.30–4.20 | 0.12 | –0.26 | |
| Secondary traumatic stress | 1–5 | 2.64±0.63 | 1.00–4.30 | –0.02 | –0.23 |
| Variable | Job stress | Perceived organizational support | Active coping | Passive coping | Compassion satisfaction | Burnout | Secondary traumatic stress |
|---|---|---|---|---|---|---|---|
| r (p) | r (p) | r (p) | r (p) | r (p) | r (p) | r (p) | |
| Job stress | 1 | ||||||
| Perceived organizational support | –.62 (<.001) | 1 | |||||
| Active coping | –.18 (.002) | .13 (.026) | 1 | ||||
| Passive coping | –.03 (.600) | .13 (.031) | .30 (<.001) | 1 | |||
| Compassion satisfaction | –.48 (<.001) | .48 (<.001) | .40 (<.001) | .13 (.021) | 1 | ||
| Burnout | .51 (<.001) | –.33 (<.001) | –.23 (<.001) | .07 (.232) | –.55 (<.001) | 1 | |
| Secondary traumatic stress | .17 (.003) | .07 (.232) | .03 (.569) | .28 (<.001) | –.04 (.445) | .56 (<.001) | 1 |
| Variable | Pathways | B | SE | Boot SE | β | t | p | 95% CI | Boot CI | F(p) | R2 |
|---|---|---|---|---|---|---|---|---|---|---|---|
| Compassion satisfaction | |||||||||||
| Total effect | X→ Y1 | –0.91 | 0.10 | –.48 | –9.51 | <.001 | –1.10 to –0.72 | ||||
| X→M1 | –1.44 | 0.11 | –.62 | –13.50 | <.001 | –1.65 to –1.23 | 182.14 (<.001) | .38 | |||
| X→M2 | –0.20 | 0.06 | –.18 | –3.11 | .010 | –0.33 to –0.07 | 9.67 (.010) | .03 | |||
| X→M3 | –0.04 | 0.07 | –.03 | –0.53 | .596 | –0.17 to 0.10 | 0.28 (.596) | ||||
| M1→ Y1 | 0.23 | 0.05 | .29 | 4.87 | <.001 | 0.14 to 0.33 | 45.59 (<.001) | .38 | |||
| M2→ Y1 | 0.53 | 0.08 | .32 | 6.46 | <.001 | 0.37 to 0.69 | |||||
| M3→ Y1 | 0.01 | 0.08 | <.01 | 0.12 | .904 | –0.16 to 0.14 | |||||
| Direct effect | X→Y1 | –0.47 | 0.11 | –.25 | –4.26 | <.001 | –0.69 to –0.26 | ||||
| Total indirect effect | –0.44 | 0.09 | –0.61 to –0.27 | ||||||||
| Indirect 1 | X→M1→ Y1 | –0.33 | 0.08 | –0.49 to –0.19 | |||||||
| Indirect 2 | X→M2→ Y1 | –0.11 | 0.04 | –0.20 to –0.03 | |||||||
| Indirect 3 | X→M3→ Y1 | <0.01 | 0.01 | –0.01 to 0.02 | |||||||
| Burnout | |||||||||||
| Total effect | X→ Y2 | 0.79 | 0.08 | .51 | 10.11 | <.001 | 0.63 to 0.94 | ||||
| X→M1 | –1.44 | 0.11 | –.62 | –13.50 | <.001 | –1.65 to –1.23 | 182.14 (<.001) | .38 | |||
| X→M2 | –0.20 | 0.06 | –.18 | –3.11 | .010 | –0.33 to –0.07 | 9.67 (.010) | .03 | |||
| X→M3 | –0.04 | 0.07 | –.03 | –0.53 | .596 | –0.17 to 0.10 | 0.28 (.596) | ||||
| M1→ Y2 | –0.03 | 0.04 | –.05 | –0.73 | .466 | –0.11 to 0.05 | 30.84 (<.001) | .30 | |||
| M2→ Y2 | –0.26 | 0.07 | –.19 | –3.62 | <.001 | –0.40 to –0.12 | |||||
| M3→ Y2 | 0.19 | 0.07 | .15 | 2.81 | .010 | 0.06 to 0.33 | |||||
| Direct effect | X→Y2 | 0.70 | 0.10 | .45 | 7.12 | <.001 | 0.51 to 0.89 | ||||
| Total indirect effect | 0.09 | 0.07 | –0.03 to 0.22 | ||||||||
| Indirect 1 | X→M1→ Y2 | 0.04 | 0.06 | –0.07 to 0.16 | |||||||
| Indirect 2 | X→M2→ Y2 | 0.05 | 0.03 | 0.01 to 0.11 | |||||||
| Indirect 3 | X→M3→ Y2 | –0.01 | 0.02 | –0.03 to 0.02 | |||||||
| Secondary traumatic stress | |||||||||||
| Total effect | X→ Y3 | 0.34 | 0.11 | .17 | 3.01 | .010 | 0.12 to 0.57 | ||||
| X→M1 | –1.44 | 0.11 | –.62 | –13.50 | <.001 | –1.65 to –1.23 | 182.14 (<.001) | .38 | |||
| X→M2 | –0.20 | 0.06 | –.18 | –3.11 | .010 | –0.33 to –0.07 | 9.67 (.010) | .03 | |||
| X→M3 | –0.04 | 0.07 | –.03 | –0.53 | .596 | –0.17 to 0.10 | 0.28 (.596) | ||||
| M1→ Y3 | –0.20 | 0.06 | –.24 | –3.44 | <.001 | –0.32 to –0.09 | 12.75 (<.001) | .15 | |||
| M2→ Y3 | –0.04 | 0.10 | –.02 | –0.37 | .711 | –0.24 to 0.16 | |||||
| M3→ Y3 | –0.46 | 0.10 | –.27 | –4.74 | <.001 | –0.64 to –0.27 | |||||
| Direct effect | X→Y3 | 0.64 | 0.14 | .32 | 4.66 | <.001 | 0.37 to 0.92 | ||||
| Total indirect effect | –0.30 | 0.10 | –0.51 to –0.11 | ||||||||
| Indirect 1 | X→M1→ Y3 | –0.29 | 0.10 | –0.49 to –0.11 | |||||||
| Indirect 2 | X→M2→ Y3 | 0.01 | 0.02 | –0.04 to 0.06 | |||||||
| Indirect 3 | X→M3→ Y3 | –0.02 | 0.04 | –0.09 to 0.06 |
Table 1. Differences in professional quality of life according to participants’ general characteristics (N=299)
Specialized units included intensive care units, operating rooms, emergency departments, central supply rooms, post-anesthesia care units, delivery rooms, and neonatal units. SD, standard deviation. By Scheffé test. a)By Mann-Whitney U test.
Table 2. Levels of job stress, perceived organizational support, coping strategies, and professional quality of life (N=299)
SD, standard deviation.
Table 3. Correlations among the variables (N=299)
Table 4. Effects of job stress on compassion satisfaction, burnout, and secondary traumatic stress: the mediating effects of perceived organizational support and coping (N=299)
Control variables: Compassion satisfaction: marital status, religion, education level, nursing experience, managerial experience, subjective health status; Burnout: age, marital status, religion, education level, working unit, nursing experience, managerial experience, subjective health status, working hours; Secondary traumatic stress: working unit, subjective health status. Boot CI, bootstrapped confidence interval; Boot SE, bootstrapped standard error; CI, confidence interval; M1, perceived organizational support; M2, active coping; M3, passive coping; R2, coefficient of determination; SE, standard error; X, job stress; Y1, compassion satisfaction; Y2, burnout; Y3, secondary traumatic stress.

