 Submit an article
Articles
- Page Path
- HOME > J Korean Acad Nurs > Volume 54(4); 2024 > Article
-
Research Paper
- Perceptual Factors Associated with Gestational Weight Gain: A Cross-Sectional Survey
-
Sehee Kim1
 , Sukhee Ahn2
 -
Journal of Korean Academy of Nursing 2024;54(4):495-508.
DOI: https://doi.org/10.4040/jkan.24052
Published online: November 1, 2024
1Department of Nursing, Pai Chai University, Daejeon, Korea
2College of Nursing, Chungnam National University, Daejeon, Korea
- Address reprint requests to : Ahn, Sukhee College of Nursing, Chungnam National University, 266 Munhwa-ro, Jung-gu, Daejeon 35015, Korea Tel: +82-42-580-8324 Fax: +82-42-580-8309 E-mail: sukheeahn@cnu.ac.kr
• Received: April 24, 2024 • Revised: July 24, 2024 • Accepted: September 3, 2024
© 2024 Korean Society of Nursing Science
This is an Open Access article distributed under the terms of the Creative Commons Attribution NoDerivs License (http://creativecommons.org/licenses/by-nd/4.0) If the original work is properly cited and retained without any modification or reproduction, it can be used and re-distributed in any format and medium.

Figure & Data
REFERENCES
Citations
Citations to this article as recorded by 
- Beyond the mirror: Exploring the impact of maternal body image attitudes on gestational weight gain and maternal and neonatal outcomes, a systematic review
Malshani Lakshika Pathirathna, Megumi Haruna, Hapugahapitiya Mohottalalage Renu Kalhari Geethani Nandasena, Atapattu Mudiyanselage Muditha Piumali, Ganegoda Widanage Umanda Dilrukshi Ganegoda
International Journal of Gynecology & Obstetrics.2026;[Epub] CrossRef - Factors Associated With Gestational Weight Gain Among Nurses in Korea
Sook Jung Kang, Woon Young Hwang, Hyunju Dan, Sue Kim, Kwang-Pil Ko
Journal of Obstetric, Gynecologic, & Neonatal Nursing.2025; 54(5): 543. CrossRef - Attitudes toward body weight and shape during pregnancy among Japanese women who were underweight before pregnancy: A qualitative study
Chisato KOROGI, Mie SHIRAISHI, Kaori MATSUDA, Natsuki HORI, Hanna HORIGUCHI
Journal of Japan Academy of Midwifery.2025; 39(3): 456. CrossRef
 ePub Link
 Cite
CitePerceptual Factors Associated with Gestational Weight Gain: A Cross-Sectional Survey
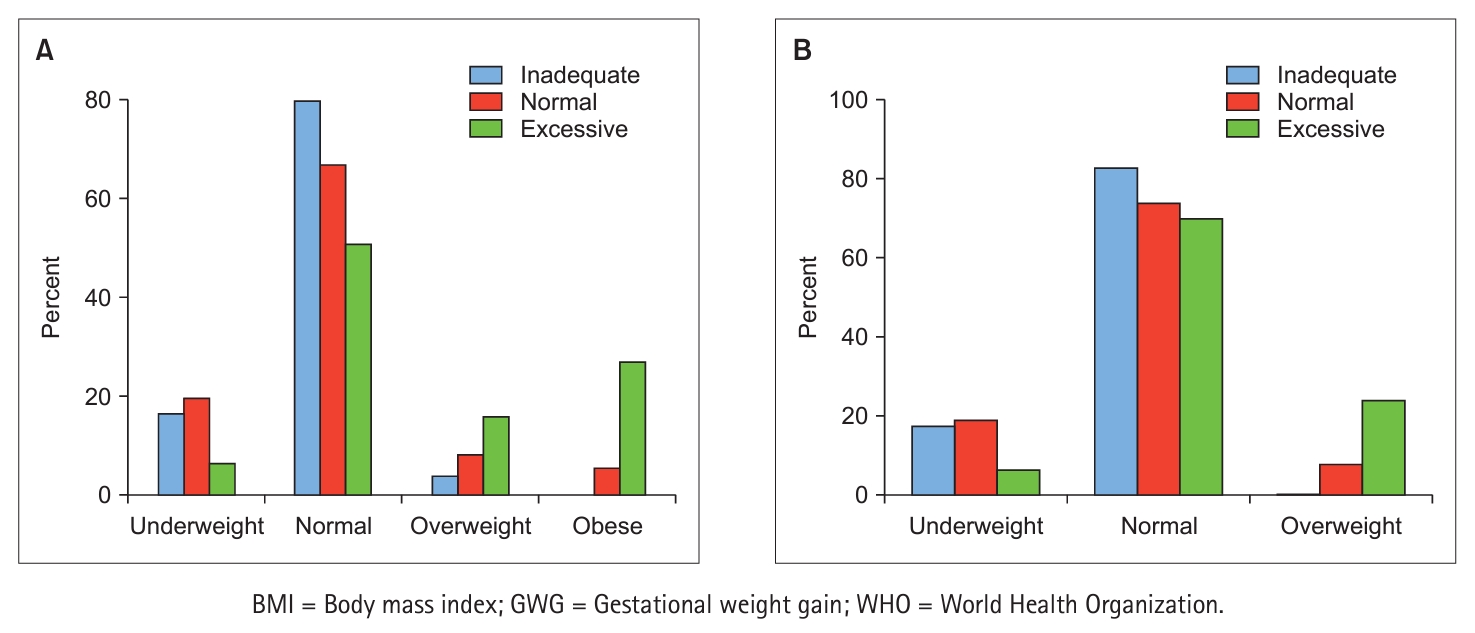
Fig. 1. Proportion of gestational weight gain adequacy with different body mass index criteria. (A) GWG recommendation with Asia Pacific prepregnancy BMI. (B) GWG recommendation with WHO international prepregnancy BMI.
Fig. 1.
Perceptual Factors Associated with Gestational Weight Gain: A Cross-Sectional Survey
| Variables | Categories | M ± SD | n (%) |
|---|---|---|---|
| Age (yr) | 33.3 ± 3.26 | ||
| 25~34 | 239 (64.8) | ||
| 35~44 | 130 (35.2) | ||
| Gestational age (wk) | 36~41 | 37.4 ± 1.00 | |
| Education | Secondary | 25 (6.8) | |
| College | 292 (79.1) | ||
| Graduate | 52 (14.1) | ||
| Occupation | Full time | 74 (20.1) | |
| Part time (h) | 10 (2.7) | ||
| Self-employed | 11 (3.0) | ||
| Quitting work due to pregnancy | 74 (20.1) | ||
| Maternity leave | 137 (37.1) | ||
| Housewife (include students) | 63 (17.0) | ||
| Household income (10,000 KRW/mo) | < 200 | 17 (4.6) | |
| 200~399 | 138 (37.4) | ||
| 400~599 | 131 (35.5) | ||
| ≥ 600 | 83 (22.5) | ||
| Smoking | Yes | 3 (0.8) | |
| No | 366 (99.2) | ||
| Drinking | Yes | 2 (0.5) | |
| No | 367 (99.5) | ||
| Body weight (kg) | Prepregnancy | 55.04 ± 7.07 | |
| Current | 66.94 ± 7.91 | ||
| Prepregnancy BMI (kg/m2) | < 18.5 | 59 (16.0) | |
| 18.5~22.9 | 257 (69.6) | ||
| 23.0~24.9 | 28 (7.6) | ||
| ≥ 25.0 | 25 (6.8) | ||
| Gestational weight gain (kg) | Total | 11.90 ± 4.08 | 369 (100.0) |
| Inadequate | 8.80 ± 1.97 | 158 (42.8) | |
| Normal | 13.22 ± 2.09 | 148 (40.1) | |
| Excessive | 17.63 ± 3.86 | 63 (17.1) |
| Characteristics | Gestational weight gain |
p-value | ||
|---|---|---|---|---|
| Inadequate (n = 158) |
Normal (n = 148) |
Excessive (n = 63) |
||
| M ± SD or n (%) | ||||
| Age (yr) |
33.1 ± 3.16 | 33.4 ± 3.51 | 33.6 ± 2.90 | .569 |
| Gestational age (wk) |
37.3 ± 0.94 | 37.5 ± 1.01 | 37.4 ± 1.10 | .330 |
| Prepregnancy BMI (kg/m2) |
||||
| < 18.5 | 26 (16.5) | 29 (19.6) | 4 (6.3) | < .001 |
| 18.5~22.9 | 126 (79.7) | 99 (66.9) | 32 (50.8) | |
| 23.0~24.9 | 6 (3.8) | 12 (8.1) | 10 (15.9) | |
| ≥ 25.0 | 0 (0.0) | 8 (5.4) | 17 (27.0) | |
| Education |
||||
| Secondary | 9 (5.7) | 8 (5.4) | 8 (12.7) | .085 |
| College | 120 (75.9) | 124 (83.8) | 48 (76.2) | |
| Graduate | 29 (18.4) | 16 (10.8) | 7 (11.1) | |
| Income (10,000 KRW/mo) |
||||
| < 200 | 7 (4.4) | 8 (5.4) | 2 (3.2) | .748 |
| 200~399 | 55 (34.8) | 56 (37.8) | 27 (42.8) | |
| 400~599 | 56 (35.5) | 56 (37.8) | 19 (30.2) | |
| ≥ 600 | 40 (25.3) | 28 (19.0) | 15 (23.8) | |
| Occupation |
||||
| Yes | 43 (27.2) | 35 (23.6) | 17 (27.0) | .752 |
| No | 115 (72.8) | 113 (76.4) | 46 (73.0) | |
| Drinking |
||||
| Yes | 1 (0.6) | 1 (0.7) | 0 (0.0) | .812 |
| No | 157 (99.4) | 147 (99.3) | 63 (100.0) | |
| Smoking |
||||
| Yes | 1 (0.6) | 0 (0.0) | 2 (3.2) | .060 |
| No | 157 (99.4) | 148 (100.0) | 61 (96.8) | |
| Variables | Crude B | SE | Exp. (B) | 95% CI | p-value | Adjusted B | SE | Exp. (B) | 95% CI | p-value |
|---|---|---|---|---|---|---|---|---|---|---|
| Age | 0.04 | 0.04 | 1.04 | 0.95~1.13 | .404 | |||||
| Pre-pregnancy BMI (kg/m2) | ||||||||||
| < 18.5 | 1 |
1 |
||||||||
| 18.5~22.9 | 0.67 | 0.55 | 1.96 | 0.66~5.76 | .224 | 0.94 | 0.76 | 2.55 | 0.58~11.30 | .217 |
| 23.0~24.9 | 2.03 | 0.65 | 7.64 | 2.13~27.36 | .002 | 3.48 | 0.97 | 32.60 | 4.84~219.51 | < .001 |
| ≥ 25.0 | 3.38 | 0.67 | 29.22 | 7.82~109.13 | < .001 | 4.64 | 0.97 | 103.25 | 15.53~686.41 | < .001 |
| Education | ||||||||||
| Secondary | 1 |
|||||||||
| College | – 0.87 | 0.46 | 0.42 | 0.17~1.02 | .056 | |||||
| Graduate | – 1.11 | 0.59 | 0.33 | 0.10~1.05 | .061 | |||||
| Income (10,000 KRW/mo) | ||||||||||
| < 200 | 1 |
|||||||||
| 200~399 | 0.60 | 0.78 | 1.82 | 0.39~8.46 | .442 | |||||
| 400~599 | 0.24 | 0.79 | 1.27 | 0.27~6.02 | .761 | |||||
| ≥ 600 | 0.50 | 0.81 | 1.65 | 0.34~8.01 | .532 | |||||
| Occupation | ||||||||||
| Yes | 1 |
|||||||||
| No | – 0.08 | 0.31 | 0.93 | 0.50~1.71 | .805 | |||||
| Self-efficacy | ||||||||||
| Healthy eating | – 0.04 | 0.01 | 0.96 | 0.93~0.99 | .003 | 0.01 | 0.03 | 1.01 | 0.96~1.06 | .619 |
| Physical activity | – 0.05 | 0.02 | 0.95 | 0.92~0.98 | < .001 | – 0.05 | 0.03 | 0.95 | 0.91~1.00 | .051 |
| Perceived barrier | ||||||||||
| Healthy eating | – 0.01 | 0.02 | 0.99 | 0.96~1.04 | .768 | |||||
| Physical activity | 0.02 | 0.02 | 1.02 | 0.99~1.05 | .290 | |||||
| Weight locus of control | ||||||||||
| Internal | – 0.72 | 0.11 | 0.49 | 0.39~0.61 | < .001 | – 0.55 | 0.18 | 0.58 | 0.41~0.82 | .002 |
| External | 0.58 | 0.10 | 1.78 | 1.47~2.14 | < .001 | 0.56 | 0.15 | 1.75 | 1.31~2.34 | < .001 |
| Body image | – 0.51 | 0.07 | 0.60 | 0.52~0.69 | < .001 | – 0.48 | 0.10 | 0.62 | 0.51~0.75 | < .001 |
| Knowledge | ||||||||||
| Maternal risk of EGWG | 0.07 | 0.22 | 1.07 | 0.70~1.63 | .758 | |||||
| Fetal risk of EGWG | – 0.15 | 0.07 | 0.86 | 0.76~0.99 | .032 | 0.02 | 0.11 | 1.02 | 0.83~1.25 | .853 |
Table 1. General Characteristics of Participants (N = 369)
BMI = Body mass index; KRW = Korean won; M = Mean; SD = Standard deviation.
Table 2. Characteristics of Participants in Gestational Weight Gain Categories (N = 369)
BMI = Body mass index; KRW = Korean won; M = Mean; SD = Standard deviation. One-way ANOVA. Chi-square test.
Table 3. Multivariate Binary Logistic Regression Determining Risk Factors of Excessive Gestational Weight Gain (N = 369)
BMI = Body mass index; CI = Confidence interval; EGWG = Excessive gestational weight gain; Exp. = Exponential; KRW = Korean won; SE = Standard error. Reference.

