
 Submit an article

Articles
- Page Path
- HOME > J Korean Acad Nurs > Volume 56(3); 2026 > Article
-
Research Paper
교대근무 간호사의 건강 및 피로·회복에 따른 잠재프로파일 분석과 교대제 개선 시범사업 효과: 서술적 단면 조사연구 -
정은희1
 , 김은혜1, 서수량1, 이선영1, 안소라1, 김혜진1, 김예슬1, 김유진1, 박미정1, 공현중2,3,4, 이사람2,4, 홍영주2, 정민호1
 - Latent profile analysis of health and fatigue recovery among shift work nurses and differential associations with participation in a shift work improvement pilot project: a descriptive cross-sectional study
-
Eunhee Jung1, Eunhye Kim1, Suryang Seo1, Sunyoung Lee1, Sora An1, Hyejin Kim1, Ye Seul Kim1, Youjin Kim1, Mijeong Park1, Hyoun-Joong Kong2,3,4, Saram Lee2,4, Yeong Joo Hong2, Minho Jung1
-
Journal of Korean Academy of Nursing 2026;56(3):358-369.
DOI: https://doi.org/10.4040/jkan.26006
Published online: July 23, 2026
1서울대학교병원 간호부문
2서울대학교병원 융합의학과
3서울대학교병원 융합의학기술원
4서울대학교 의과대학 의학과
1Department of Nursing, Seoul National University Hospital, Seoul, South Korea
2Department of Transdisciplinary Medicine, Seoul National University Hospital, Seoul, South Korea
3Institute of Convergence Medicine with Innovative Technology, Seoul National University Hospital, Seoul, South Korea
4Department of Medicine, Seoul National University College of Medicine, Seoul, South Korea
- Corresponding author: Minho Jung Department of Nursing, Seoul National University Hospital, 101 Daehak-ro, Jongno-gu, Seoul 03080, South Korea E-mail: 16187@snuh.org
• Received: January 21, 2026 • Revised: April 9, 2026 • Accepted: June 12, 2026
© 2026 Korean Society of Nursing Science
This is an Open Access article distributed under the terms of the Creative Commons Attribution NoDerivs License (http://creativecommons.org/licenses/by-nd/4.0) If the original work is properly cited and retained without any modification or reproduction, it can be used and re-distributed in any format and medium.
- 899 Views
- 84 Download


Abstract
-
Purpose
- This study aimed to identify latent profiles of shift-work nurses according to perceived health, fatigue, and recovery levels and to examine differences across profiles in work-related outcomes, including sleep quality, work-life balance, job satisfaction, and turnover intention. It also examined whether patterns associated with participation in a shift-work improvement pilot project differed by latent profile.
-
Methods
- This descriptive cross-sectional study included 120 shift-work nurses working in pediatric wards at a tertiary hospital in South Korea. Data were collected from January 14 to 24, 2025. Latent profile analysis was performed using the 36-Item Short Form Health Survey and the Occupational Fatigue Exhaustion Recovery Scale. Differences in outcomes by latent profile membership and pilot-project participation status at the time of data collection were examined using two-way analysis of covariance, with age included as a covariate.
-
Results
- Three latent profiles were identified: Healthy-Recovery (20.8%), Moderate (41.7%), and Burnout-Vulnerable (37.5%). Significant differences among profiles were observed in sleep quality (F=37.37, p<.001), work-life balance (F=50.86, p<.001), job satisfaction (F=12.29, p<.001), and turnover intention (F=12.11, p<.001). A significant interaction between latent profile membership and pilot-project participation was observed for job satisfaction (F=4.77, p=.010, partial η²=.078). Pilot-project participation was associated with significantly higher job satisfaction only in the Healthy-Recovery profile (p=.005).
-
Conclusion
- Associations between pilot-project participation and work-related outcomes differed according to nurses’ health, fatigue, and recovery profiles. These findings indicate that heterogeneity among shift-work nurses should be considered when interpreting work-related outcomes and designing tailored support strategies.
서론
방법
1) 일반적 특성
2) 잠재프로파일 지표변수
(1) 지각된 건강상태
(2) 직무 피로 및 회복
3) 결과변수
(1) 수면의 질
(2) 일-삶의 균형
(3) 교대근무 직무만족도
(4) 이직의도
결과
고찰
결론
-
Conflicts of Interest
No potential conflict of interest relevant to this article was reported.
-
Acknowledgements
None.
-
Funding
This study was supported by the Seoul National University Hospital Research Fund in 2025.
-
Data Sharing Statement
Please contact the corresponding author for data availability.
-
Author Contributions
Conceptualization: EJ, EK, SA, YK, MJ. Methodology: EJ, EK, SA, YK, MJ. Software: MJ. Validation: EK, SA, YK, MJ. Formal analysis: EJ, EK, MJ. Investigation: EK, Sunyoung L, SA, HK, YSK, YK. Resources: MJ. Data curation: EJ, EK, MJ. Visualization: MJ. Supervision: EJ, EK. Project administration: EJ, EK. Funding acquisition: EJ. Writing–original draft: SS, Sunyoung L, SA. Writing–review & editing: EJ, EK, HK, YSK, YK, MP, HJK, Saram L, YJH, MJ. Final approval of the manuscript: all authors.
Article Information
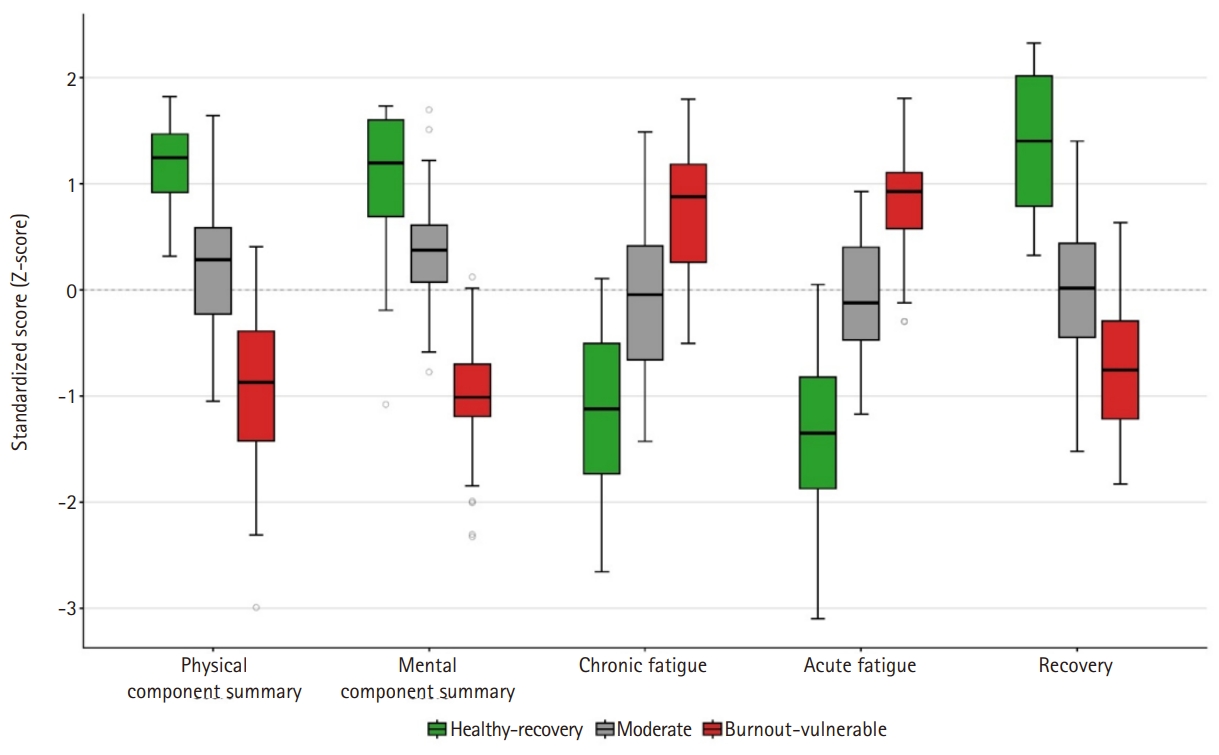
Table 1.General characteristics of participants and homogeneity testing (N=120)
| Characteristic | Total (N=120) | Intervention group (n=70) | Control group (n=50) | p | Effect size |
|---|---|---|---|---|---|
| Age (yr) | 28.0 (26.0–32.5) | 28.0 (26.0–32.0) | 28.5 (25.0–34.0) | .491a) | 0.17b) |
| Gender | .172c) | .12d) | |||
| Women | 118 (98.3) | 70 (100.0) | 48 (96.0) | ||
| Men | 2 (1.7) | 0 (0.0) | 2 (4.0) | ||
| Marital status | .254e) | .05d) | |||
| Single | 87 (72.5) | 48 (68.6) | 39 (78.0) | ||
| Married | 33 (27.5) | 22 (31.4) | 11 (22.0) | ||
| Education | >.999c) | .00d) | |||
| Bachelor’s degree | 115 (95.8) | 67 (95.7) | 48 (96.0) | ||
| Master’s degree or higher | 5 (4.2) | 3 (4.3) | 2 (4.0) | ||
| Clinical career (mo) | 58.0 (23.5–110.0) | 55.5 (23.0–93.0) | 61.5 (24.0–120.0) | .243a) | 0.18b) |
Table 2.Model fit indices and classification quality for the latent profile analysis (N=120)
The average posterior probabilities for each model were as follows: Model 2 (0.958, 0.972), Model 3 (0.937, 0.928, 0.914), Model 4 (0.960, 0.955, 0.953, 0.897), and Model 5 (0.925, 0.945, 0.959, 0.919, 0.956).
AIC, Akaike information criterion; AWE, approximate weight of evidence; BIC, Bayesian information criterion; BLRT, bootstrap likelihood ratio test; SABIC, sample-size adjusted Bayesian information criterion.
Table 3.Differences in study variables among latent profiles (N=120)
Table 4.Age-adjusted least-squares means of outcome variables by latent profile and intervention status (N=120)
Values are age-adjusted least-squares means with 95% confidence intervals. p-values represent comparisons between the intervention and control groups within each latent profile based on the age-adjusted ANCOVA model. Bonferroni-adjusted post hoc comparisons for the profile main effect were as follows: a=Healthy-Recovery (n=25), b=Moderate (n=50), and c=Burnout-Vulnerable (n=45). Overall effects were obtained from the two-way ANCOVA adjusted for age, with partial η² presented in parentheses. CI, confidence interval; LS mean, least-squares mean; P×I, profile-by-intervention interaction; partial η², partial eta squared.
- 1. Inchingolo AD, Inchingolo AM, Fatone MC, Ferrante L, Casamassima L, Trilli I, et al. Guidelines for reducing the adverse effects of shift work on nursing staff: a systematic review. Healthcare (Basel). 2025;13(17):2148. https://doi.org/10.3390/healthcare13172148ArticlePubMedPMC
- 2. Min A, Hong HC, Kim YM. Work schedule characteristics and occupational fatigue/recovery among rotating-shift nurses: a cross-sectional study. J Nurs Manag. 2022;30(2):463-472. https://doi.org/10.1111/jonm.13511ArticlePubMed
- 3. Roman P, Perez-Cayuela I, Gil-Hernández E, Rodriguez-Arrastia M, Aparicio-Mota A, Ropero-Padilla C, et al. Influence of shift work on the health of nursing professionals. J Pers Med. 2023;13(4):627. https://doi.org/10.3390/jpm13040627ArticlePubMedPMC
- 4. Ki J, Ryu J, Baek J, Huh I, Choi-Kwon S. Association between health problems and turnover intention in shift work nurses: health problem clustering. Int J Environ Res Public Health. 2020;17(12):4532. https://doi.org/10.3390/ijerph17124532ArticlePubMedPMC
- 5. de Vries N, Boone A, Godderis L, Bouman J, Szemik S, Matranga D, et al. The race to retain healthcare workers: a systematic review on factors that impact retention of nurses and physicians in hospitals. Inquiry. 2023;60:469580231159318. https://doi.org/10.1177/00469580231159318ArticlePubMedPMC
- 6. Matsuo M, Suzuki E, Takayama Y, Shibata S, Sato K. Influence of striving for work-life balance and sense of coherence on intention to leave among nurses: a 6-month prospective survey. Inquiry. 2021;58:469580211005192. https://doi.org/10.1177/00469580211005192ArticlePubMedPMC
- 7. Li JN, Chen XQ, Jiang XM, Zheng QX, Pan YQ, Zhu Y, et al. Exploring the associations between chronotype, night shift work schedule, quality of work life, and sleep quality among maternal and child health nurses: a multicentre cross-sectional study. J Nurs Manag. 2023;2023:1811732. https://doi.org/10.1155/2023/1811732ArticlePubMedPMC
- 8. Bae SH. Noneconomic and economic impacts of nurse turnover in hospitals: a systematic review. Int Nurs Rev. 2022;69(3):392-404. https://doi.org/10.1111/inr.12769ArticlePubMedPMC
- 9. Booker LA, Magee M, Rajaratnam SM, Sletten TL, Howard ME. Individual vulnerability to insomnia, excessive sleepiness and shift work disorder amongst healthcare shift workers: a systematic review. Sleep Med Rev. 2018;41:220-233. https://doi.org/10.1016/j.smrv.2018.03.005ArticlePubMed
- 10. Hobfoll SE. Conservation of resources: a new attempt at conceptualizing stress. Am Psychol. 1989;44(3):513-524. https://doi.org/10.1037//0003-066x.44.3.513ArticlePubMed
- 11. Park YD, You SJ. Effect of the nursing work environment on turnover intention: serial mediation effects of career motivation and job satisfaction. J Korean Acad Nurs Adm. 2023;29(5):529-539. https://doi.org/10.11111/jkana.2023.29.5.529Article
- 12. Zheng J, Feng S, Feng Y, Wang L, Gao R, Xue B. Relationship between burnout and turnover intention among nurses: a network analysis. BMC Nurs. 2024;23(1):921. https://doi.org/10.1186/s12912-024-02624-2ArticlePubMedPMC
- 13. Ministry of Health and Welfare. Nurse shift system improvement pilot project participating organization competition [Internet]. Ministry of Health and Welfare; 2022 [cited 2026 Apr 4]. Available from: https://www.mohw.go.kr/board.es?mid=a10501010100&bid=0003&act=view&list_no=370310&tag=&nPage=1
- 14. Choi SJ, Kim MS, Jeon MK, Choi JJ, Son SY, Kim EH. The effects of a shift improvement pilot project on nurses’ shift adjustment, work-life balance, and turnover intention: a mixed-methods study. J Korean Clin Nurs Res. 2023;29(3):223-237. https://doi.org/10.22650/JKCNR.2023.29.3.223Article
- 15. Tein JY, Coxe S, Cham H. Statistical power to detect the correct number of classes in latent profile analysis. Struct Equ Modeling. 2013;20(4):640-657. https://doi.org/10.1080/10705511.2013.824781ArticlePubMedPMC
- 16. Van Lissa CJ, Garnier-Villarreal M, Anadria D. Recommended practices in latent class analysis using the open-source R-package tidySEM. Struct Equ Model. 2024;31(3):526-534. https://doi.org/10.1080/10705511.2023.2250920Article
- 17. Ream RS, Mackey K, Leet T, Green MC, Andreone TL, Loftis LL, et al. Association of nursing workload and unplanned extubations in a pediatric intensive care unit. Pediatr Crit Care Med. 2007;8(4):366-371. https://doi.org/10.1097/01.PCC.0000269379.40748.AFArticlePubMedPDF
- 18. Connor JA, LaGrasta C, Cerrato B, Porter C, Gauvreau K, Morrill D, et al. Measuring acuity and pediatric critical care nursing workload by using ICU CAMEO III. Am J Crit Care. 2022;31(2):119-126. https://doi.org/10.4037/ajcc2022907ArticlePubMed
- 19. Ware JE, Sherbourne CD. The MOS 36-item Short-Form Health Survey (SF-36). I. Conceptual framework and item selection. Med Care. 1992;30(6):473-483. https://doi.org/10.1097/00005650-199206000-00002ArticlePubMedPMC
- 20. Koh SB, Chang SJ, Kang MG, Cha BS, Park JK. Reliability and validity on measurement instrument for health status assessment in occupational workers. Korean J Prev Med. 1997;30(2):251-266.
- 21. Nam BH, Lee SW. Testing the validity of the Korean SF-36 Health Survey. J Health Info Stat. 2003;28(2):3-24.Article
- 22. Grassi M, Nucera A; European Community Respiratory Health Study Quality of Life Working Group. Dimensionality and summary measures of the SF-36 v1.6: comparison of scale- and item-based approach across ECRHS II adults population. Value Health. 2010;13(4):469-478. https://doi.org/10.1111/j.1524-4733.2009.00684.xArticlePubMed
- 23. Winwood PC, Winefield AH, Dawson D, Lushington K. Development and validation of a scale to measure work-related fatigue and recovery: the Occupational Fatigue Exhaustion/Recovery Scale (OFER). J Occup Environ Med. 2005;47(6):594-606. https://doi.org/10.1097/01.jom.0000161740.71049.c4ArticlePubMed
- 24. Min A, Min H, Hong HC. Psychometric properties of the Korean version of the Occupational Fatigue Exhaustion Recovery Scale in a nurse population. Res Nurs Health. 2019;42(5):358-368. https://doi.org/10.1002/nur.21980ArticlePubMed
- 25. Buysse DJ, Reynolds CF, Monk TH, Berman SR, Kupfer DJ. The Pittsburgh Sleep Quality Index: a new instrument for psychiatric practice and research. Psychiatry Res. 1989;28(2):193-213. https://doi.org/10.1016/0165-1781(89)90047-4ArticlePubMedPMC
- 26. Sohn SI, Kim DH, Lee MY, Cho YW. The reliability and validity of the Korean version of the Pittsburgh Sleep Quality Index. Sleep Breath. 2012;16(3):803-812. https://doi.org/10.1007/s11325-011-0579-9ArticlePubMed
- 27. Park E, Lee HY, Park CS. Association between sleep quality and nurse productivity among Korean clinical nurses. J Nurs Manag. 2018;26(8):1051-1058. https://doi.org/10.1111/jonm.12634ArticlePubMed
- 28. Kim CW, Park C. A study on the development of a ‘Work-Life Balance’ scale. J Leis Stud. 2008;5(3):53-69. https://doi.org/10.22879/slos.2008.5.3.53Article
- 29. Im HM, Kim EH, Lee JH. Development of the measuring scale for shift-work job satisfaction for nurses. J Soc Converg Stud. 2024;8(2):1-13. https://doi.org/10.37181/JSCS.2024.8.2.001Article
- 30. Mobley WH. Intermediate linkages in the relationship between job satisfaction and employee turnover. J Appl Psychol. 1977;62(2):237-240. https://doi.org/10.1037/0021-9010.62.2.237Article
- 31. Mobley WH, Horner SO, Hollingsworth AT. An evaluation of precursors of hospital employee turnover. J Appl Psychol. 1978;63(4):408-414. https://doi.org/10.1037/0021-9010.63.4.408ArticlePubMed
- 32. Kim IO, Kim SH, Im SA, Roh H. The effects of work-life balance on the turnover intention of hospital nurses by mediating job satisfaction. J Employ Career. 2022;12(4):1-18. https://doi.org/10.35273/jec.2022.12.4.001Article
- 33. Lee S, Lee DK. What is the proper way to apply the multiple comparison test? Korean J Anesthesiol. 2018;71(5):353-360. https://doi.org/10.4097/kja.d.18.00242Article
- 34. Hong J, Kim M, Suh EE, Cho S, Jang S. Comparison of fatigue, quality of life, turnover intention, and safety incident frequency between 2-shift and 3-shift Korean nurses. Int J Environ Res Public Health. 2021;18(15):7953. https://doi.org/10.3390/ijerph18157953ArticlePubMedPMC
- 35. Dziak JJ, Bray BC, Zhang J, Zhang M, Lanza ST. Comparing the performance of improved classify-analyze approaches for distal outcomes in latent profile analysis. Methodology (Gott). 2016;12(4):107-116. https://doi.org/10.1027/1614-2241/a000114Article
- 36. Xiao Q, Huang X, Yang T, Huang L, Li N, Wang J, et al. Determinants of sleep quality and their impact on health outcomes: a cross-sectional study on night-shift nurses. Front Psychiatry. 2024;15:1506061. https://doi.org/10.3389/fpsyt.2024.1506061ArticlePubMedPMC
- 37. Jung YJ, Kim H. Job satisfaction, quality of life, and turnover intention among nurses: a comparative study of pattern-based and rotating shift schedules. Healthcare (Basel). 2025;13(20):2551. https://doi.org/10.3390/healthcare13202551ArticlePubMedPMC
- 38. Kim EK, Choi EH. Effects of a new nursing delivery system on nurses’ satisfaction, self-efficacy, job stress, and nursing performance in a university hospital. J Korean Acad Nurs Adm. 2017;23(3):301-311. https://doi.org/10.11111/jkana.2017.23.3.301Article
- 39. Kang HW, Kim J, Kim KJ, Bae EK, Kang H, Jang JH, et al. Shift nurses’ work quality and job satisfaction after implementing the Inha University hospital nursing AI scheduling system (IH-NASS). BMC Nurs. 2025;24(1):792. https://doi.org/10.1186/s12912-025-03470-6ArticlePubMedPMC
- 40. Lim JY, Kim GM, Kim EJ. Factors associated with turnover intention among hospital nurses: a systematic review and meta-analysis. J Korean Acad Psychiatr Ment Health Nurs. 2024;33(1):70-79. https://doi.org/10.12934/jkpmhn.2024.33.1.70Article
References
Figure & Data
REFERENCES
Citations
Citations to this article as recorded by 
 ePub Link
 Cite
Cite XML Download
Latent profile analysis of health and fatigue recovery among shift work nurses and differential associations with participation in a shift work improvement pilot project: a descriptive cross-sectional study
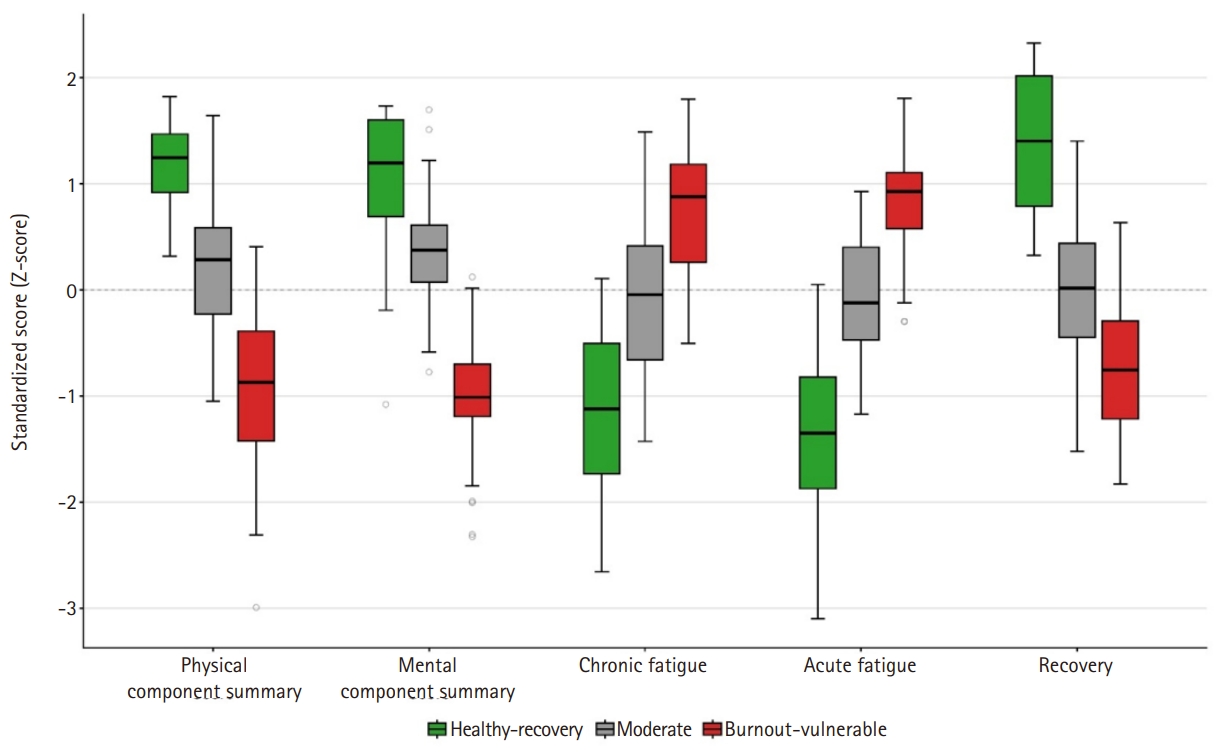
Fig. 1. Latent profiles of nurses based on health, fatigue, and recovery indicators.
Fig. 1.
Latent profile analysis of health and fatigue recovery among shift work nurses and differential associations with participation in a shift work improvement pilot project: a descriptive cross-sectional study
| Characteristic | Total (N=120) | Intervention group (n=70) | Control group (n=50) | p | Effect size |
|---|---|---|---|---|---|
| Age (yr) | 28.0 (26.0–32.5) | 28.0 (26.0–32.0) | 28.5 (25.0–34.0) | .491 |
0.17 |
| Gender | .172 |
.12 |
|||
| Women | 118 (98.3) | 70 (100.0) | 48 (96.0) | ||
| Men | 2 (1.7) | 0 (0.0) | 2 (4.0) | ||
| Marital status | .254 |
.05 |
|||
| Single | 87 (72.5) | 48 (68.6) | 39 (78.0) | ||
| Married | 33 (27.5) | 22 (31.4) | 11 (22.0) | ||
| Education | >.999 |
.00 |
|||
| Bachelor’s degree | 115 (95.8) | 67 (95.7) | 48 (96.0) | ||
| Master’s degree or higher | 5 (4.2) | 3 (4.3) | 2 (4.0) | ||
| Clinical career (mo) | 58.0 (23.5–110.0) | 55.5 (23.0–93.0) | 61.5 (24.0–120.0) | .243 |
0.18 |
| Model | Information criteria | Accuracy of classification | Fit differences | Class proportions (%) | |||
|---|---|---|---|---|---|---|---|
| AIC | AWE | BIC | SABIC | Entropy | BLRT (p) | ||
| 1 | 5,169.22 | 5,272.97 | 5,197.09 | 5,165.48 | - | - | - |
| 2 | 4,917.33 | 5,084.75 | 4,961.93 | 4,911.34 | .890 | <.001 | 37.5, 62.5 |
| 3 | 4,848.74 | 5,079.72 | 4,910.07 | 4,840.51 | .837 | <.001 | 20.8, 37.5, 41.7 |
| 4 | 4,804.08 | 5,098.43 | 4,882.13 | 4,793.61 | .874 | <.001 | 8.3, 28.3, 25.0, 38.3 |
| 5 | 4,805.35 | 5,163.13 | 4,900.12 | 4,792.63 | .886 | .141 | 26.7, 28.3, 3.3, 36.7, 5.0 |
| Classification | Healthy-Recovery (n=25)a | Moderate (n=50)b | Burnout-Vulnerable (n=45)c | F | p | η2 | Post hoc test (Bonferroni) |
|---|---|---|---|---|---|---|---|
| Perceived health status | |||||||
| PCS | 89.67±6.04 | 76.01±8.88 | 60.32±10.03 | 93.39 | <.001 | .615 | a>b>c |
| MCS | 80.15±9.35 | 70.30±7.04 | 51.14±8.01 | 125.71 | <.001 | .682 | a>b>c |
| Occupational fatigue and recovery | |||||||
| Chronic fatigue | 49.33±17.19 | 71.73±15.95 | 91.04±13.42 | 60.69 | <.001 | .509 | c>b>a |
| Acute fatigue | 53.20±15.20 | 77.67±10.13 | 94.81±10.11 | 108.61 | <.001 | .650 | c>b>a |
| Recovery | 86.00±12.55 | 56.40±14.33 | 39.70±12.97 | 94.89 | <.001 | .619 | a>b>c |
| Outcome variables | |||||||
| Sleep quality (PSQI) | 4.68±2.08 | 7.60±2.82 | 10.51±2.99 | 37.37 | <.001 | .390 | c>b>a |
| Work-life balance | 107.72±17.09 | 86.82±14.58 | 70.36±14.07 | 50.86 | <.001 | .465 | a>b>c |
| Shift work job satisfaction | 32.60±6.44 | 26.96±5.66 | 25.53±5.69 | 12.29 | <.001 | .174 | a>b,c |
| Turnover intention | 6.72±2.72 | 8.38±2.89 | 10.07±2.68 | 12.11 | <.001 | .171 | c>a,b |
| Outcome | Latent profile | Control LS mean (95% CI) | Intervention LS mean (95% CI) | p | Profile post hoc | Overall ANCOVA effects, p (partial η²) |
|---|---|---|---|---|---|---|
| Sleep quality | Healthy-Recoverya | 5.00 (2.54–7.46) | 4.56 (3.31–5.81) | .754 | c>b>a | Profile: <.001 (.342); Intervention: .252 (.012); P×I: .855 (.003) |
| Moderateb | 7.85 (6.79–8.91) | 7.32 (6.17–8.47) | .502 | |||
| Burnout-Vulnerablec | 11.19 (9.89–12.49) | 10.08 (9.02–11.13) | .191 | |||
| Work-life balance | Healthy-Recoverya | 109.41 (96.04–122.77) | 106.50 (99.68–113.31) | .702 | a>b>c | Profile: <.001 (.396); Intervention: .489 (.004); P×I: .992 (.000) |
| Moderateb | 87.78 (82.03–93.54) | 85.96 (79.71–92.21) | .672 | |||
| Burnout-Vulnerablec | 71.83 (64.74–78.93) | 69.73 (63.98–75.48) | .648 | |||
| Shift work job satisfaction | Healthy-Recoverya | 26.40 (21.40–31.39) | 34.53 (31.98–37.07) | .005 | a>c | Profile: .017 (.069); Intervention: .047 (.034); P×I: .010 (.078) |
| Moderateb | 26.31 (24.16–28.46) | 27.59 (25.26–29.93) | .425 | |||
| Burnout-Vulnerablec | 26.65 (24.00–29.31) | 24.62 (22.47–26.77) | .240 | |||
| Turnover intention | Healthy-Recoverya | 7.60 (5.25–9.96) | 6.05 (4.85–7.25) | .246 | c>a,b | Profile: <.001 (.159); Intervention: .363 (.007); P×I: .545 (.011) |
| Moderateb | 8.39 (7.38–9.40) | 8.52 (7.42–9.62) | .862 | |||
| Burnout-Vulnerablec | 10.28 (9.03–11.53) | 10.12 (9.11–11.14) | .847 |
Table 1. General characteristics of participants and homogeneity testing (N=120)
Values are presented as median (Q1–Q3) for continuous variables and number (%) for categorical variables. By Wilcoxon rank sum test. Cohen’s d. By Fisher’s exact test. Cramer’s V. By Pearson’s chi-square test.
Table 2. Model fit indices and classification quality for the latent profile analysis (N=120)
The average posterior probabilities for each model were as follows: Model 2 (0.958, 0.972), Model 3 (0.937, 0.928, 0.914), Model 4 (0.960, 0.955, 0.953, 0.897), and Model 5 (0.925, 0.945, 0.959, 0.919, 0.956). AIC, Akaike information criterion; AWE, approximate weight of evidence; BIC, Bayesian information criterion; BLRT, bootstrap likelihood ratio test; SABIC, sample-size adjusted Bayesian information criterion.
Table 3. Differences in study variables among latent profiles (N=120)
Values are presented as mean±standard deviation unless otherwise stated. MCS, mental component summary; PCS, physical component summary; PSQI, Pittsburgh Sleep Quality Index; η2, eta squared.
Table 4. Age-adjusted least-squares means of outcome variables by latent profile and intervention status (N=120)
Values are age-adjusted least-squares means with 95% confidence intervals. p-values represent comparisons between the intervention and control groups within each latent profile based on the age-adjusted ANCOVA model. Bonferroni-adjusted post hoc comparisons for the profile main effect were as follows: a=Healthy-Recovery (n=25), b=Moderate (n=50), and c=Burnout-Vulnerable (n=45). Overall effects were obtained from the two-way ANCOVA adjusted for age, with partial η² presented in parentheses. CI, confidence interval; LS mean, least-squares mean; P×I, profile-by-intervention interaction; partial η², partial eta squared.


