 Submit an article
Articles
- Page Path
- HOME > J Korean Acad Nurs > Volume 55(2); 2025 > Article
-
Research Paper
- Effectiveness of a mobile application for tracking symptoms and enhancing symptom management among breast cancer patients receiving chemotherapy in Bangkok, Thailand: a non-randomized controlled trial
-
Duangrat Kaveenuntachai1
 , Supawan Jaiboon2, Bualuang Sumdaengrit3, Chureeporn Silaguntsuti4, Arveewan Vittayatigonnasak4, Pornchan Sailamai5
 -
Journal of Korean Academy of Nursing 2025;55(2):178-190.
DOI: https://doi.org/10.4040/jkan.25011
Published online: May 27, 2025
1Kuakarun Faculty of Nursing, Navamindradhiraj University, Bangkok, Thailand
2Faculty of Nursing, Maejo University, Chiang Mai, Thailand
3Faculty of Medicine Ramathibodi Hospital, Mahidol University, Bangkok, Thailand
4Faculty of Medicine Vajira Hospital, Navamindradhiraj University, Bangkok, Thailand
5National Cancer Institute, Bangkok, Thailand
- Corresponding author: Supawan Jaiboon Faculty of Nursing, Maejo University, 63 Moo 4, Nong Han Subdistrict, San Sai District, Chiang Mai Province 50290, Thailand E-mail: Sup.jaiboon@gmail.com, supawan_jb@mju.ac.th
• Received: February 2, 2025 • Revised: April 27, 2025 • Accepted: April 27, 2025
© 2025 Korean Society of Nursing Science
This is an Open Access article distributed under the terms of the Creative Commons Attribution NoDerivs License (http://creativecommons.org/licenses/by-nd/4.0) If the original work is properly cited and retained without any modification or reproduction, it can be used and re-distributed in any format and medium.
Abstract
-
Purpose
- This study evaluated the effectiveness of a mobile application in tracking symptoms and improving symptom management and quality of life (QoL) among breast cancer patients undergoing chemotherapy in Thailand.
-
Methods
- A non-randomized controlled trial was used, with 25 participants in the intervention group and 25 in the control group. Research instruments included a demographic data form, the NCI-PRO-CTCAE Items-Thai-Thailand version 1.0, and the European Organization for Research and Treatment of Cancer Quality of Life Core Questionnaire and Breast Cancer-Specific Module.
-
Results
- The intervention group had significantly less severe side effects than the control group, with mean differences of –23.33 (95% confidence interval [CI], –27.82 to –18.83) on day 1, –28.18 (95% CI, –33.22 to –23.14) on day 3, –34.63 (95% CI, –40.18 to –29.08) on day 7, –42.56 (95% CI, –48.72 to –36.40) on day 14, and –51.31 (95% CI, –58.13 to –44.48) on day 21 (p<.001 for all). On day 21, participants in the intervention group reported significantly higher scores in the Global Health QoL and Functional Scales compared to the control group (p<.001). Additionally, intervention group participants reported lower scores on the Symptom Scales and higher scores on the Functional Scales than those in the control group (p<.001).
-
Conclusion
- The ChemoPro application helped manage chemotherapy-related symptoms and was associated with improved symptom monitoring and QoL. Nonetheless, the study was limited by a small sample size and restriction to Android users. Future research with larger and more diverse populations is recommended before broader implementation in clinical practice.
Introduction
Methods
1) Demographic data form
2) The NCI-PRO-CTCAE Items-Thai-Thailand version 1.0
3) The European Organization for Research and Treatment of Cancer Quality of Life Core Questionnaire
4) The European Organization for Research and Treatment of Cancer Quality of Life Core Questionnaire breast cancer specific module
1) Pre-test (baseline data collection)
2) Intervention description (ChemoPro Application)
3) Control group management
4) Post-test (follow-up evaluation)
Results
1) QoL (EORTC QLQ-C30)
2) QoL (EORTC QLQ-BR23)
Discussion
Conclusion
-
Conflicts of Interest
No potential conflict of interest relevant to this article was reported.
-
Acknowledgements
None.
-
Funding
This study was funded by Navamindradhiraj University Research Fund.
-
Data Sharing Statement
Please contact the corresponding author for data availability.
-
Author Contributions
Conceptualization and/or Methodology: DK, SJ, BS. Data curation and/or Analysis: DK, SJ, BS. Funding acquisition: DK, SJ. Investigation: DK, SJ, BS, CS, PS. Project administration and/or Supervision: DK, SJ. Resources and/or Software: DK, SJ. Validation: DK, SJ, BS. Visualization: DK, SJ. Writing: original draft and/or Review & Editing: SJ, DK, BS. Final approval of the manuscript: all authors.
Article Information
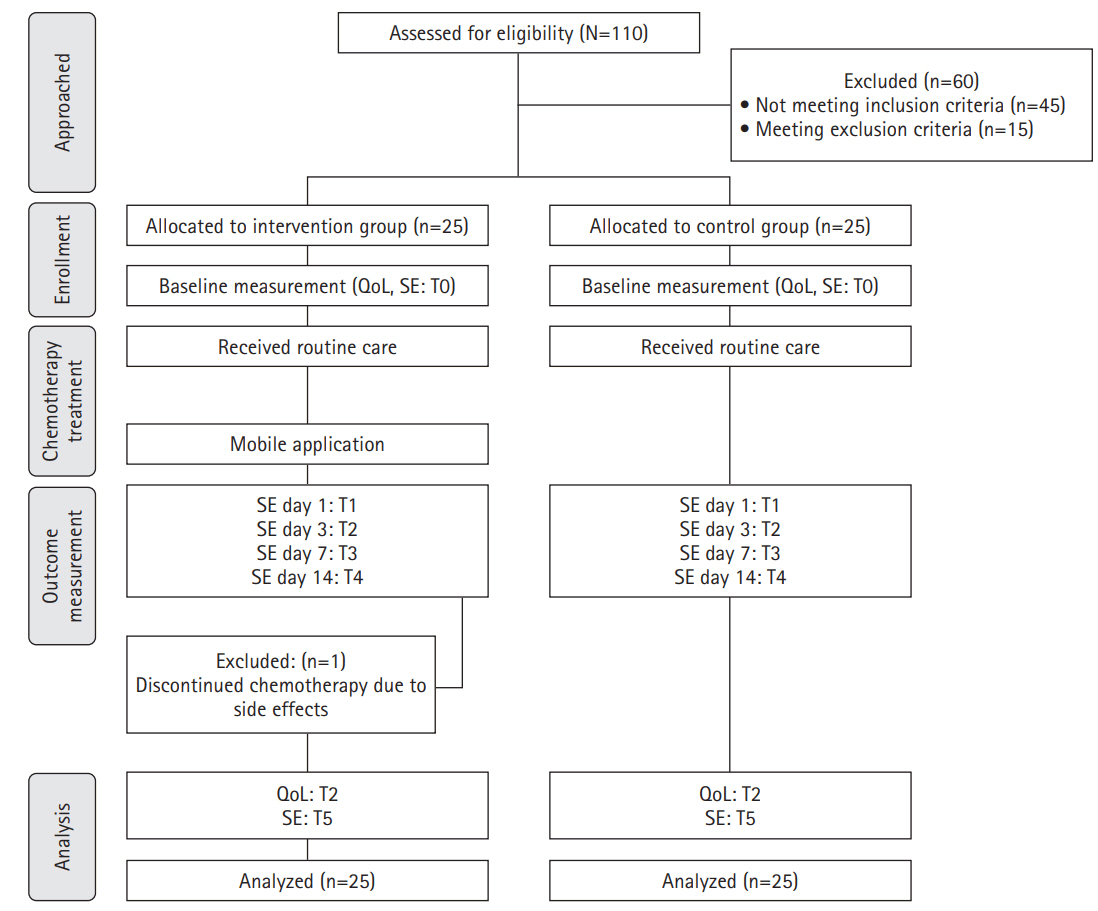
Fig. 2.Comparison of mean side effect scores between intervention and control groups across all time points. NCI-PRO-CTCAE, National Cancer Institute–Patient-Reported Outcomes version of the Common Terminology Criteria for Adverse Events.

Table 1.Homogeneity of demographic and clinical characteristics between intervention and control groups (N=50)
| Demographics and clinical data | Intervention group (n=25) | Control group (n=25) | p |
|---|---|---|---|
| Age (yr) | 54.6±8.44 | 54.1±9.53 | .839a) |
| Educational level | |||
| Primary | 2 (8.0) | 9 (36.0) | .060b) |
| Secondary | 6 (24.0) | 2 (8.0) | |
| Diploma | 7 (28.0) | 7 (28.0) | |
| Undergraduate | 10 (40.0) | 6 (24.0) | |
| Missing | 0 | 1 (4.0) | |
| Marital status | |||
| Married/living together | 15 (60.0) | 18 (72.0) | .478b) |
| Single | 5 (20.0) | 2 (8.0) | |
| Widowed | 2 (8.0) | 3 (12.0) | |
| Divorced | 3 (12.0) | 1 (4.0) | |
| Separated | 0 | 1 (4.0) | |
| Occupational status | |||
| Government official/government-owned company | 4 (16.0) | 0 | .052b) |
| Employee company | 2 (8.0) | 5 (20.0) | |
| Self-employed/freelance | 9 (36.0) | 6 (24.0) | |
| Work for money | 3 (12.0) | 1 (4.0) | |
| Housekeeper | 2 (8.0) | 8 (32.0) | |
| Retired | 2 (8.0) | 0 | |
| Others | 1 (4.0) | 1 (4.0) | |
| Unemployed | 2 (8.0) | 4 (16.0) | |
| Health care welfare | |||
| Universal coverage | 10 (40.0) | 12 (48.0) | .231b) |
| Social security scheme | 8 (32.0) | 11 (44.0) | |
| Government enterprise officer | 6 (24.0) | 1 (4.0) | |
| Cash rights | 1 (4.0) | 1 (4.0) | |
| Time since diagnosis (yr) | 2 (1–5) | 1 (0.5–4) | .050c) |
| Treatments received | |||
| Chemotherapy | 25 (100.0) | 25 (100.0) | >.999 |
| Surgery | 0 | 12 (48.0) | <.001d) |
| Radiation | 0 | 4 (16.0) | .110b) |
| Chemotherapy received | |||
| AC | 15 (60.0) | 16 (64.0) | .771d) |
| Paclitaxel | 10 (40.0) | 9 (36.0) | |
| Cancer stage | |||
| 1 | 6 (24.0) | 7 (28.0) | .845d) |
| 2 | 6 (24.0) | 5 (20.0) | |
| 3 | 7 (28.0) | 9 (36.0) | |
| 4 | 6 (24.0) | 4 (16.0) |
Table 2.Effects of a mobile application for tracking symptoms and enhancing symptom management on QoL assessed by EORTC-QLQ-C30 among breast cancer patients receiving chemotherapy (N=50)
Table 3.Effects of a mobile application for tracking symptoms and enhancing symptom management on QoL assessed by EORTC QLQ-BR23 among breast cancer patients receiving chemotherapy (N=50)
Table 4.Effects of a mobile application for tracking symptoms and enhancing symptom management on side effects scores assessed by NCI-PRO-CTCAE Items-Thai-Thailand version 1.0 among breast cancer patients receiving chemotherapy (N=50)
- 1. Giaquinto AN, Sung H, Newman LA, Freedman RA, Smith RA, Star J, et al. Breast cancer statistics 2024. CA Cancer J Clin. 2024;74(6):477-495. https://doi.org/10.3322/caac.21863ArticlePubMed
- 2. International Agency for Research on Cancer; World Health Organization; Global Cancer Observatory. Thailand fact sheet [Internet]. International Agency for Research on Cancer; 2022 [cited 2025 Jan 10]. Available from: https://gco.iarc.who.int/media/globocan/factsheets/populations/764-thailand-fact-sheet.pdf
- 3. Thai Breast Disease Society; Thai Breast Surgeons Club; National Cancer Institute; Department of Medical Services. Breast cancer: screening, diagnosis, and treatment guidelines [Internet]. Vitta Compute System; 2023 [cited 2025 Jan 10] Available from: https://www.nci.go.th/th/cpg_index.html. In Thai.
- 4. Dan D, Fischer R, Adler S, Förger F, Villiger PM. Cyclophosphamide: as bad as its reputation? Long-term single centre experience of cyclophosphamide side effects in the treatment of systemic autoimmune diseases. Swiss Med Wkly. 2014;144:w14030. https://doi.org/10.4414/smw.2014.14030ArticlePubMed
- 5. Ogino MH, Tadi P. Cyclophosphamide [Internet]. StatPearls Publishing; 2021 [cited 2025 Jan 10]. Available from: https://www.ncbi.nlm.nih.gov/books/NBK553087/
- 6. Hanoodi M, Mittal M. Methotrexate [Internet]. StatPearls Publishing; 2021 [cited 2025 Jan 10]. Available from: https://www.ncbi.nlm.nih.gov/books/NBK556114/
- 7. Casale J, Patel P. Fluorouracil [Internet]. StatPearls Publishing; 2022 [cited 2025 Jan 10]. Available from: https://www.ncbi.nlm.nih.gov/books/NBK549808/
- 8. Douedi S, Carson MP. Anthracycline medications (doxorubicin) [Internet]. StatPearls Publishing; 2021 [cited 2025 Jan 10]. Available from: https://www.ncbi.nlm.nih.gov/books/NBK551633/
- 9. Farha NG, Kasi A. Docetaxel [Internet]. StatPearls Publishing; 2021 [cited 2025 Jan 10]. Available from: https://www.ncbi.nlm.nih.gov/books/NBK537242/
- 10. Baoraksa C, Chanthawong S. Assessment of knowledge in cancer patients undergoing chemotherapy at Udon Thani Hospital. Srinagarind Med J. 2018;33(5):495-500. https://li01.tci-thaijo.org/index.php/SRIMEDJ/article/view/141518
- 11. Kaopunsilp S, Pongmesa T. Quality of life in female breast cancer patients during treatment with fluorouracil, doxorubicin, and cyclophosphamide (FAC). Songkla Nakharin Med J [Internet]. 2017 [cited 2025 Jan 10];35(4):373-384. Available from: http://smj.medicine.psu.ac.th/index.php/smj/article/view/753
- 12. American Cancer Society. Cancer treatment and survivorship: facts and figures 2019-2021 [Internet]. American Cancer Society; 2019 [cited 2025 Jan 10]. Available from: https://www.cancer.org/content/dam/cancer-org/research/cancer-facts-and-statistics/cancer-treatment-and-survivorship-facts-and-figures/cancer-treatment-and-survivorship-facts-and-figures-2019-2021.pdf
- 13. Hamood R, Hamood H, Merhasin I, Keinan-Boker L. Chronic pain and other symptoms among breast cancer survivors: prevalence, predictors, and effects on quality of life. Breast Cancer Res Treat. 2018;167(1):157-169. https://doi.org/10.1007/s10549-017-4485-0ArticlePubMed
- 14. Schmidt ME, Wiskemann J, Steindorf K. Quality of life, problems, and needs of disease-free breast cancer survivors 5 years after diagnosis. Qual Life Res. 2018;27(8):2077-2086. https://doi.org/10.1007/s11136-018-1866-8ArticlePubMed
- 15. Jones KR, Lekhak N, Kaewluang N. Using mobile phones and short message service to deliver self-management interventions for chronic conditions: a meta-review. Worldviews Evid Based Nurs. 2014;11(2):81-88. https://doi.org/10.1111/wvn.12030ArticlePubMed
- 16. Egbring M, Far E, Roos M, Dietrich M, Brauchbar M, Kullak-Ublick GA, et al. A mobile app to stabilize daily functional activity of breast cancer patients in collaboration with the physician: a randomized controlled clinical trial. J Med Internet Res. 2016;18(9):e238. https://doi.org/10.2196/jmir.6414ArticlePubMedPMC
- 17. Grašič Kuhar C, Gortnar Cepeda T, Kovač T, Kukar M, Ružić Gorenjec N. Mobile app for symptom management and associated quality of life during systemic treatment in early stage breast cancer: nonrandomized controlled prospective cohort study. JMIR Mhealth Uhealth. 2020;8(8):e17408. https://doi.org/10.2196/17408ArticlePubMedPMC
- 18. Öztürk ES, Kutlutürkan S. The effect of the mobile application-based symptom monitoring process on the symptom control and quality of life in breast cancer patients. Semin Oncol Nurs. 2021;37(3):151161. https://doi.org/10.1016/j.soncn.2021.151161ArticlePubMed
- 19. Bender JL, Yue RY, To MJ, Deacken L, Jadad AR. A lot of action, but not in the right direction: systematic review and content analysis of smartphone applications for the prevention, detection, and management of cancer. J Med Internet Res. 2013;15(12):e287. https://doi.org/10.2196/jmir.2661ArticlePubMedPMC
- 20. Oldenmenger WH, Baan MA, van der Rijt CC. Development and feasibility of a web application to monitor patients’ cancer-related pain. Support Care Cancer. 2018;26(2):635-642. https://doi.org/10.1007/s00520-017-3877-3ArticlePubMed
- 21. Çınar D, Karadakovan A, Erdoğan AP. Effect of mobile phone app-based training on the quality of life for women with breast cancer. Eur J Oncol Nurs. 2021;52:101960. https://doi.org/10.1016/j.ejon.2021.101960ArticlePubMed
- 22. Zhu J, Ebert L, Liu X, Wei D, Chan SW. Mobile breast cancer e-support program for Chinese women with breast cancer undergoing chemotherapy (part 2): multicenter randomized controlled trial. JMIR Mhealth Uhealth. 2018;6(4):e104. https://doi.org/10.2196/mhealth.9438ArticlePubMedPMC
- 23. Yotsawee W, Kaewkong N, Lothammam P, Chidnayee S, Chaiwongnakphan C, Tummee S. Adjustment of women with breast cancer. J Boromarajonani Coll Nurs Uttaradit. 2019;11(2):272-283. In Thai.
- 24. National Cancer Institute. Patient-Reported Outcomes Version of the Common Terminology Criteria for Adverse Events (PRO-CTCAE) Item Library (version 1): certified translation [Internet]. National Cancer Institute; 2020 [cited 2025 Jan 10]. Available from: https://healthcaredelivery.cancer.gov/pro-ctcae/certificates/pro-ctcae/pro-ctcae_cert_thai.pdf
- 25. Silpakit C, Sirilerttrakul S, Jirajarus M, Sirisinha T, Sirachainan E, Ratanatharathorn V. The European Organization for Research and Treatment of Cancer Quality of Life Questionnaire (EORTC QLQ-C30): validation study of the Thai version. Qual Life Res. 2006;15(1):167-172. https://doi.org/10.1007/s11136-005-0449-7ArticlePubMed
- 26. Glangkarn S, Promasatayaprot V, Porock D, Edgley A. Measuring quality of life in Thai women with breast cancer. Asian Pac J Cancer Prev. 2011;12(3):637-644. PubMed
- 27. Dodd M, Janson S, Facione N, Faucett J, Froelicher ES, Humphreys J, et al. Advancing the science of symptom management. J Adv Nurs. 2001;33(5):668-676. https://doi.org/10.1046/j.1365-2648.2001.01697.xArticlePubMed
- 28. National Cancer Institute. Common terminology criteria for adverse events (CTCAE) version 5.0 [Internet]. National Cancer Institute; 2017 [cited 2025 Jan 10]. Available from: https://ctep.cancer.gov/protocoldevelopment/electronic_applications/docs/CTCAE_v5_Quick_Reference_5x7.pdf
- 29. BC Cancer. Symptom management guidelines [Internet]. BC Cancer; 2019 [cited 2025 Jan 10]. Available from: http://www.bccancer.bc.ca/health-professionals/clinical-resources/nursing/symptom-management
- 30. American Cancer Society. Managing cancer-related side effects [Internet]. American Cancer Society; 2021 [cited 2025 Jan 10]. 2021. Available from: https://www.cancer.org/treatment/treatments-and-side-effects/physical-side-effects.html
- 31. Kim HJ, Kim SM, Shin H, Jang JS, Kim YI, Han DH. A mobile game for patients with breast cancer for chemotherapy self-management and quality-of-life improvement: randomized controlled trial. J Med Internet Res. 2018;20(10):e273. https://doi.org/10.2196/jmir.9559ArticlePubMedPMC
- 32. Fjell M, Langius-Eklöf A, Nilsson M, Wengström Y, Sundberg K. Reduced symptom burden with the support of an interactive app during neoadjuvant chemotherapy for breast cancer: a randomized controlled trial. Breast. 2020;51:85-93. https://doi.org/10.1016/j.breast.2020.03.004ArticlePubMedPMC
- 33. Eldeib HK, Abbassi MM, Hussein MM, Salem SE, Sabry NA. The effect of telephone-based follow-up on adherence, efficacy, and toxicity of oral capecitabine-based chemotherapy. Telemed J E Health. 2019;25(6):462-470. https://doi.org/10.1089/tmj.2018.0077ArticlePubMed
- 34. Hou IC, Lin HY, Shen SH, Chang KJ, Tai HC, Tsai AJ, et al. Quality of life of women after a first diagnosis of breast cancer using a self-management support mHealth app in Taiwan: randomized controlled trial. JMIR Mhealth Uhealth. 2020;8(3):e17084. https://doi.org/10.2196/17084ArticlePubMedPMC
- 35. Sarbaz M, Monazah FM, Eslami S, Kimiafar K, Baigi SF. Effect of mobile health interventions for side effects management in patients undergoing chemotherapy: a systematic review. Health Policy Technol. 2022;11(4):100680. https://doi.org/10.1016/j.hlpt.2022.100680Article
- 36. Kruse CS, Pacheco GJ, Vargas B, Lozano N, Castro S, Gattu M. Leveraging telehealth for the management of breast cancer: a systematic review. Healthcare (Basel). 2022;10(10):2015. https://doi.org/10.3390/healthcare10102015ArticlePubMedPMC
- 37. Chen X, Chaimongkol N, Hengudomsub P. Effects of a phone-based support program for women with breast cancer undergoing chemotherapy: a pilot study. SAGE Open Nurs. 2024;10:23779608241231176. https://doi.org/10.1177/23779608241231176ArticlePubMedPMC
- 38. Shi N, Ching Wong AK, Yuet Wong FK, Zhang N, Zhu W, Shen K, et al. Feasibility of a mobile health app-based self-management program for Chinese patients with breast cancer receiving chemotherapy: a randomized controlled pilot study. Digit Health. 2024;10:20552076241231560. https://doi.org/10.1177/20552076241231560ArticlePubMedPMC
- 39. Movsas B. What are the real pros of real-time PROs (patient-reported outcomes)? JCO Oncol Pract. 2025;Jan 31 [Epub]. https://doi.org/10.1200/OP-24-01000Article
- 40. Nazarpour S, Mohammadipour F, Mohammadi R, Goudarzi F, Esmaeilbeigy D. The effect of telephone counseling and follow-up on empowering women with breast cancer undergoing chemotherapy. Health Care Women Int. 2022;43(12):1415-1432. https://doi.org/10.1080/07399332.2021.1941026ArticlePubMed
- 41. Zhang X, Sun S, Jiangenuer L, Zhao P, Lei H, Xu Z, et al. Effect of mobile health (mHealth) on improving anxiety, depression and quality of life in cancer patients: a systematic review and meta -analysis. J Affect Disord. 2025;374:11-25. https://doi.org/10.1016/j.jad.2025.01.016ArticlePubMed
- 42. Gyawali B, Bowman M, Sharpe I, Jalink M, Srivastava S, Wijeratne DT. A systematic review of eHealth technologies for breast cancer supportive care. Cancer Treat Rev. 2023;114:102519. https://doi.org/10.1016/j.ctrv.2023.102519ArticlePubMed
- 43. Yanez B, Oswald LB, Baik SH, Buitrago D, Iacobelli F, Perez-Tamayo A, et al. Brief culturally informed smartphone interventions decrease breast cancer symptom burden among Latina breast cancer survivors. Psychooncology. 2020;29(1):195-203. https://doi.org/10.1002/pon.5281ArticlePubMed
References
Figure & Data
REFERENCES
Citations
Citations to this article as recorded by 
- Effectiveness of a digital health intervention on the supportive care needs and quality of life in Mexican patients with breast cancer: a randomized clinical trial
Saúl Eduardo Contreras-Sánchez, Svetlana V. Doubova, Rocío Grajales-Álvarez, Ricardo Villalobos-Valencia, Abdel Karim Dip-Borunda, José Gustavo Nuñez-Cerrillo, Alma Diana Huerta-López, Álvaro José Montiel-Jarquín, Arturo García-Galicia, Enrique Isay Talam
BMC Cancer.2026;[Epub] CrossRef - Systematic review of patient-reported outcome item libraries in cancer research: an EORTC Quality of Life Group study
Rosemary Peacock, Christopher Bedding, Bonnie Pacheco, Hayat Hamzeh, Claire Piccinin, Alexandra Gilbert
JNCI: Journal of the National Cancer Institute.2026; 118(6): 971. CrossRef - Digital PRO collection methods during chemotherapy: A scoping review of tools, platforms, and psychometric properties
G. Hari Prakash, Tejaswini BD, Sony Sequeira, Mohammed Mujaheed Hussain, Anush Nayak
Measurement and Evaluations in Cancer Care.2026; 4: 100036. CrossRef
 ePub Link
 Cite
CiteEffectiveness of a mobile application for tracking symptoms and enhancing symptom management among breast cancer patients receiving chemotherapy in Bangkok, Thailand: a non-randomized controlled trial


Fig. 1. Flowchart of participant enrollment and allocation. QoL, quality of life; SE, side effect.
Fig. 2. Comparison of mean side effect scores between intervention and control groups across all time points. NCI-PRO-CTCAE, National Cancer Institute–Patient-Reported Outcomes version of the Common Terminology Criteria for Adverse Events.
Fig. 1.
Fig. 2.
Effectiveness of a mobile application for tracking symptoms and enhancing symptom management among breast cancer patients receiving chemotherapy in Bangkok, Thailand: a non-randomized controlled trial
| Demographics and clinical data | Intervention group (n=25) | Control group (n=25) | p |
|---|---|---|---|
| Age (yr) | 54.6±8.44 | 54.1±9.53 | .839 |
| Educational level | |||
| Primary | 2 (8.0) | 9 (36.0) | .060 |
| Secondary | 6 (24.0) | 2 (8.0) | |
| Diploma | 7 (28.0) | 7 (28.0) | |
| Undergraduate | 10 (40.0) | 6 (24.0) | |
| Missing | 0 | 1 (4.0) | |
| Marital status | |||
| Married/living together | 15 (60.0) | 18 (72.0) | .478 |
| Single | 5 (20.0) | 2 (8.0) | |
| Widowed | 2 (8.0) | 3 (12.0) | |
| Divorced | 3 (12.0) | 1 (4.0) | |
| Separated | 0 | 1 (4.0) | |
| Occupational status | |||
| Government official/government-owned company | 4 (16.0) | 0 | .052 |
| Employee company | 2 (8.0) | 5 (20.0) | |
| Self-employed/freelance | 9 (36.0) | 6 (24.0) | |
| Work for money | 3 (12.0) | 1 (4.0) | |
| Housekeeper | 2 (8.0) | 8 (32.0) | |
| Retired | 2 (8.0) | 0 | |
| Others | 1 (4.0) | 1 (4.0) | |
| Unemployed | 2 (8.0) | 4 (16.0) | |
| Health care welfare | |||
| Universal coverage | 10 (40.0) | 12 (48.0) | .231 |
| Social security scheme | 8 (32.0) | 11 (44.0) | |
| Government enterprise officer | 6 (24.0) | 1 (4.0) | |
| Cash rights | 1 (4.0) | 1 (4.0) | |
| Time since diagnosis (yr) | 2 (1–5) | 1 (0.5–4) | .050 |
| Treatments received | |||
| Chemotherapy | 25 (100.0) | 25 (100.0) | >.999 |
| Surgery | 0 | 12 (48.0) | <.001 |
| Radiation | 0 | 4 (16.0) | .110 |
| Chemotherapy received | |||
| AC | 15 (60.0) | 16 (64.0) | .771 |
| Paclitaxel | 10 (40.0) | 9 (36.0) | |
| Cancer stage | |||
| 1 | 6 (24.0) | 7 (28.0) | .845 |
| 2 | 6 (24.0) | 5 (20.0) | |
| 3 | 7 (28.0) | 9 (36.0) | |
| 4 | 6 (24.0) | 4 (16.0) |
| QoL | Intervention group |
Control group |
Mean difference (95% CI) | p | ||
|---|---|---|---|---|---|---|
| Mean change from baseline (95% CI) | p | Mean change from baseline (95% CI) | p | |||
| Global health status/QoL | 12.50 (4.31 to 20.69) | .003 | –35.00 (–43.03 to –26.97) | <.001 | 47.50 (36.03 to 58.97) | <.001 |
| Functional scales | ||||||
| Physical functioning | 2.50 (–3.97 to 8.97) | .449 | –36.53 (–42.87 to –30.2) | <.001 | 39.03 (29.98 to 48.09) | <.001 |
| Role functioning | –1.39 (–8.48 to 5.70) | .701 | –40.67 (–47.61 to –33.72) | <.001 | 39.28 (29.36 to 49.20) | <.001 |
| Emotional functioning | 6.94 (–0.10 to 13.99) | .053 | –39.00 (–45.90 to –32.10) | <.001 | 45.94 (36.08 to 55.81) | <.001 |
| Cognitive functioning | –0.69 (–6.96 to 5.57) | .828 | –41.33 (–47.47 to –35.2) | <.001 | 40.64 (31.87 to 49.40) | <.001 |
| Social functioning | –2.08 (–11.45 to 7.28) | .663 | –43.33 (–52.51 to –34.16) | <.001 | 41.25 (28.14 to 54.36) | <.001 |
| Symptom scales | ||||||
| Fatigue | 8.33 (1.53 to 15.14) | .016 | 32.00 (25.33 to 38.67) | <.001 | –23.67 (–33.19 to –14.14) | <.001 |
| Nausea and vomiting | –0.69 (–6.31 to 4.92) | .808 | 39.33 (33.83 to 44.83) | <.001 | –40.03 (–47.89 to –32.17) | <.001 |
| Pain | –6.25 (–14.28 to 1.78) | .127 | 35.33 (27.46 to 43.20) | <.001 | –41.58 (–52.83 to –30.34) | <.001 |
| Dyspnea | –1.39 (–12.39 to 9.61) | .805 | 34.67 (23.89 to 45.45) | <.001 | –36.06 (–51.46 to –20.65) | <.001 |
| Insomnia | –9.72 (–22.01 to 2.57) | .121 | 29.33 (17.29 to 41.37) | <.001 | –39.06 (–56.26 to –21.85) | <.001 |
| Appetite loss | –2.78 (–12.91 to 7.35) | .591 | 30.67 (20.74 to 40.59) | <.001 | –33.44 (–47.62 to –19.27) | <.001 |
| Constipation | –1.39 (–12.55 to 9.77) | .807 | 28.00 (17.06 to 38.94) | <.001 | –29.39 (–45.01 to –13.76) | <.001 |
| Diarrhea | –1.39 (–9.36 to 6.58) | .733 | 25.33 (17.52 to 33.15) | <.001 | –26.72 (–37.89 to –15.55) | <.001 |
| Financial difficulties | 4.17 (–4.73 to 13.06) | .358 | 45.33 (36.62 to 54.05) | <.001 | –41.17 (–53.62 to –28.72) | <.001 |
| Dimension/dimension of QoL | Intervention group |
Control group |
Mean difference (95% CI) | p | ||
|---|---|---|---|---|---|---|
| Mean change from baseline (95% CI) | p | Mean change from baseline (95% CI) | p | |||
| Symptom scales | ||||||
| Systemic therapy side effects | –9.33 (–15.12 to –3.53) | .002 | 28.00 (22.32 to 33.68) | <.001 | –37.33 (–45.43 to –29.22) | <.001 |
| Upset by hair loss | 4.17 (–7.88 to 16.22) | .498 | 37.33 (25.53 to 49.14) | <.001 | –33.17 (–50.04 to –16.30) | <.001 |
| Arm symptoms | –12.50 (–20.26 to –4.74) | .002 | 28.44 (20.84 to 36.05) | <.001 | –40.94 (–51.81 to –30.08) | <.001 |
| Breast symptoms | –7.99 (–13.78 to –2.19) | .007 | 29.67 (23.99 to 35.34) | <.001 | –37.65 (–45.77 to –29.54) | <.001 |
| Functional scales | ||||||
| Body image | 1.04 (–6.30 to 8.38) | .781 | –33.33 (–40.53 to –26.14) | <.001 | 34.38 (24.10 to 44.65) | <.001 |
| Future perspective | –1.39 (–12.99 to 10.22) | .815 | –29.33 (–40.70 to –17.96) | <.001 | 27.94 (11.70 to 44.19) | .001 |
| Sexual functioning | –8.89 (–18.00 to 0.23) | .056 | –22.00 (–30.85 to –13.15) | <.001 | 13.11 (0.41 to 25.82) | .043 |
| Sexual enjoyment | –6.94 (–17.4 to 3.51) | .193 | –14.67 (–24.91 to –4.42) | .005 | 7.72 (–6.92 to 22.36) | .301 |
| Overall score of side effects | Intervention group |
Control group |
Mean difference (95% CI) | p | ||
|---|---|---|---|---|---|---|
| Mean change from baseline (95% CI) | p | Mean change from baseline (95% CI) | p | |||
| Day 1 after chemotherapy | –3.44 (–6.62 to –0.26) | .034 | 19.89 (16.87 to 22.91) | <.001 | –23.33 (–27.82 to –18.83) | <.001 |
| Day 3 after chemotherapy | –3.48 (–7.04 to 0.08) | .056 | 24.70 (21.37 to 28.04) | <.001 | –28.18 (–33.22 to –23.14) | <.001 |
| Day 7 after chemotherapy | –3.83 (–7.77 to 0.11) | .057 | 30.80 (27.22 to 34.37) | <.001 | –34.63 (–40.18 to –29.08) | <.001 |
| Day 14 after chemotherapy | –5.07 (–9.45 to –0.68) | .024 | 37.49 (33.63 to 41.36) | <.001 | –42.56 (–48.72 to –36.40) | <.001 |
| Day 21 after chemotherapy | –6.12 (–10.96 to –1.28) | .013 | 45.19 (40.98 to 49.40) | <.001 | –51.31 (–58.13 to –44.48) | <.001 |
Table 1. Homogeneity of demographic and clinical characteristics between intervention and control groups (N=50)
Values are presented as mean±standard deviation, number (%), or median (interquartile range). AC, doxorubicin and cyclophosphamide. By independent-samples t-test. By Fisher’s exact test. By Mann-Whitney U test. By chi-square test.
Table 2. Effects of a mobile application for tracking symptoms and enhancing symptom management on QoL assessed by EORTC-QLQ-C30 among breast cancer patients receiving chemotherapy (N=50)
Analyses used a linear mixed-effects model with an autoregressive correlation matrix adjusted for baseline values. CI, confidence interval; EORTC-QLQ-C30, European Organization for Research and Treatment of cancer–Quality of Life Questionnaire Core 30; QoL, quality of life.
Table 3. Effects of a mobile application for tracking symptoms and enhancing symptom management on QoL assessed by EORTC QLQ-BR23 among breast cancer patients receiving chemotherapy (N=50)
Analyses used a linear mixed-effects model with an autoregressive correlation matrix adjusted for baseline values. CI, confidence interval; EORTC-QLQ-C30, European Organization for Research and Treatment of cancer–Quality of Life Questionnaire Core 30; QoL, quality of life.
Table 4. Effects of a mobile application for tracking symptoms and enhancing symptom management on side effects scores assessed by NCI-PRO-CTCAE Items-Thai-Thailand version 1.0 among breast cancer patients receiving chemotherapy (N=50)
Analyses used a linear mixed-effects model with an autoregressive correlation matrix adjusted for baseline values. CI, confidence interval; NCI-PRO-CTCAE, National Cancer Institute–Patient-Reported Outcomes version of the Common Terminology Criteria for Adverse Events.

